May 3, 2025
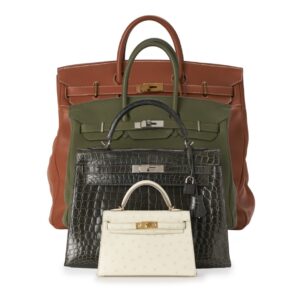
IndexBox has just published a new report: World – Luggage And Handbags – Market Analysis, Forecast, Size, Trends and Insights.
Driven by global demand, the luggage and handbag market is expected to see continued growth over the next decade. Market performance is forecasted to have a CAGR of +0.5% in volume and +1.8% in value from 2024 to 2035, reaching 6.2B units and $61.3B in nominal prices, respectively.
Market Forecast
Driven by increasing demand for luggage and handbags worldwide, the market is expected to continue an upward consumption trend over the next decade. Market performance is forecast to retain its current trend pattern, expanding with an anticipated CAGR of +0.5% for the period from 2024 to 2035, which is projected to bring the market volume to 6.2B units by the end of 2035.
In value terms, the market is forecast to increase with an anticipated CAGR of +1.8% for the period from 2024 to 2035, which is projected to bring the market value to $61.3B (in nominal wholesale prices) by the end of 2035.

Consumption
World’s Consumption of Luggage And Handbags
In 2024, global consumption of luggage and handbags rose to 5.8B units, picking up by 2.8% compared with the previous year. In general, consumption continues to indicate a relatively flat trend pattern. As a result, consumption attained the peak volume of 11B units. From 2021 to 2024, the growth of the global consumption failed to regain momentum.
The global luggage market revenue dropped to $50.6B in 2024, shrinking by -5.4% against the previous year. This figure reflects the total revenues of producers and importers (excluding logistics costs, retail marketing costs, and retailers’ margins, which will be included in the final consumer price). Overall, consumption recorded moderate growth. As a result, consumption attained the peak level of $91.8B. From 2021 to 2024, the growth of the global market failed to regain momentum.
Consumption By Country
China (1B units) remains the largest luggage consuming country worldwide, accounting for 18% of total volume. Moreover, luggage consumption in China exceeded the figures recorded by the second-largest consumer, the United States (427M units), twofold. India (377M units) ranked third in terms of total consumption with a 6.5% share.
In China, luggage consumption remained relatively stable over the period from 2013-2024. The remaining consuming countries recorded the following average annual rates of consumption growth: the United States (+0.1% per year) and India (+1.5% per year).
In value terms, China ($8.6B) led the market, alone. The second position in the ranking was taken by the United States ($3.4B). It was followed by Germany.
From 2013 to 2024, the average annual rate of growth in terms of value in China amounted to +2.6%. The remaining consuming countries recorded the following average annual rates of market growth: the United States (+1.7% per year) and Germany (+4.2% per year).
In 2024, the highest levels of luggage per capita consumption was registered in the Netherlands (7.5 units per person), followed by the UK (2.1 units per person), Germany (1.5 units per person) and the United States (1.3 units per person), while the world average per capita consumption of luggage was estimated at 0.7 units per person.
From 2013 to 2024, the average annual rate of growth in terms of the luggage per capita consumption in the Netherlands totaled +15.9%. In the other countries, the average annual rates were as follows: the UK (-0.6% per year) and Germany (-0.1% per year).
Production
World’s Production of Luggage And Handbags
For the fourth year in a row, the global market recorded growth in production of luggage and handbags, which increased by 7.2% to 9.5B units in 2024. Overall, the total production indicated a slight expansion from 2013 to 2024: its volume increased at an average annual rate of +1.4% over the last eleven-year period. The trend pattern, however, indicated some noticeable fluctuations being recorded throughout the analyzed period. Based on 2024 figures, production increased by +30.7% against 2020 indices. The most prominent rate of growth was recorded in 2016 when the production volume increased by 60% against the previous year. As a result, production attained the peak volume of 12B units. From 2017 to 2024, global production growth failed to regain momentum.
In value terms, luggage production expanded notably to $84.3B in 2024 estimated in export price. The total output value increased at an average annual rate of +3.9% from 2013 to 2024; however, the trend pattern indicated some noticeable fluctuations being recorded in certain years. The growth pace was the most rapid in 2017 with an increase of 12%. Global production peaked in 2024 and is expected to retain growth in the near future.
Production By Country
China (6.5B units) constituted the country with the largest volume of luggage production, accounting for 68% of total volume. Moreover, luggage production in China exceeded the figures recorded by the second-largest producer, India (551M units), more than tenfold. Saudi Arabia (215M units) ranked third in terms of total production with a 2.3% share.
In China, luggage production remained relatively stable over the period from 2013-2024. The remaining producing countries recorded the following average annual rates of production growth: India (+2.3% per year) and Saudi Arabia (+44.9% per year).
Imports
World’s Imports of Luggage And Handbags
For the third consecutive year, the global market recorded growth in supplies from abroad of luggage and handbags, which increased by 1.2% to 3.4B units in 2024. Overall, imports recorded a relatively flat trend pattern. The pace of growth appeared the most rapid in 2020 with an increase of 171% against the previous year. As a result, imports attained the peak of 8.1B units. From 2021 to 2024, the growth of global imports failed to regain momentum.
In value terms, luggage imports declined to $44B in 2024. Over the period under review, total imports indicated a notable expansion from 2013 to 2024: its value increased at an average annual rate of +3.5% over the last eleven-year period. The trend pattern, however, indicated some noticeable fluctuations being recorded throughout the analyzed period. The pace of growth was the most pronounced in 2021 when imports increased by 26%. Over the period under review, global imports reached the maximum at $48.3B in 2023, and then contracted in the following year.
Imports By Country
In 2024, the United States (370M units) and India (351M units) were the key importers of luggage and handbagsaround the world, together finishing at approx. 21% of total imports. It was followed by Mexico (180M units), the Netherlands (179M units) and the UK (155M units), together mixing up a 15% share of total imports. The following importers – Italy (142M units), Brazil (139M units), Spain (108M units), Thailand (108M units) and France (99M units) – together made up 18% of total imports.
From 2013 to 2024, the most notable rate of growth in terms of purchases, amongst the main importing countries, was attained by India (with a CAGR of +21.2%), while imports for the other global leaders experienced more modest paces of growth.
In value terms, the United States ($5.4B) constitutes the largest market for imported luggage and handbags worldwide, comprising 12% of global imports. The second position in the ranking was held by France ($2.5B), with a 5.7% share of global imports. It was followed by Italy, with a 5% share.
From 2013 to 2024, the average annual rate of growth in terms of value in the United States totaled +2.2%. In the other countries, the average annual rates were as follows: France (+1.5% per year) and Italy (+3.1% per year).
Imports By Type
Handbags with outer surface of plastic sheeting or of textile materials represented the main imported product with an import of about 1.8B units, which resulted at 54% of total imports. Cases and containers; trunks, suit-cases, vanity-cases, executive-cases, brief-cases, school satchels and similar containers, with outer surface of plastics or of textile materials (632M units) ranks second in terms of the total imports with a 19% share, followed by travel sets; for personal toilet, sewing, shoe or clothes cleaning (10%), handbags with outer surface of vulcanised fibre or of paperboard (9.4%) and handbags with outer surface of leather, composition leather, or patent leather (4.8%). Cases and containers; trunks, suit-cases, vanity-cases, executive-cases, brief-cases, school satchels and similar containers, with outer surface of vulcanised fibre or of paperboard (82M units) followed a long way behind the leaders.
Imports of handbags with outer surface of plastic sheeting or of textile materials increased at an average annual rate of +1.7% from 2013 to 2024. At the same time, handbags with outer surface of vulcanised fibre or of paperboard (+5.6%), cases and containers; trunks, suit-cases, vanity-cases, executive-cases, brief-cases, school satchels and similar containers, with outer surface of vulcanised fibre or of paperboard (+3.3%) and travel sets; for personal toilet, sewing, shoe or clothes cleaning (+1.1%) displayed positive paces of growth. Moreover, handbags with outer surface of vulcanised fibre or of paperboard emerged as the fastest-growing type imported in the world, with a CAGR of +5.6% from 2013-2024. By contrast, handbags with outer surface of leather, composition leather, or patent leather (-1.2%) and cases and containers; trunks, suit-cases, vanity-cases, executive-cases, brief-cases, school satchels and similar containers, with outer surface of plastics or of textile materials (-2.4%) illustrated a downward trend over the same period. Handbags with outer surface of plastic sheeting or of textile materials (+4.8 p.p.) and handbags with outer surface of vulcanised fibre or of paperboard (+3.8 p.p.) significantly strengthened its position in terms of the global imports, while cases and containers; trunks, suit-cases, vanity-cases, executive-cases, brief-cases, school satchels and similar containers, with outer surface of plastics or of textile materials saw its share reduced by -7.9% from 2013 to 2024, respectively. The shares of the other products remained relatively stable throughout the analyzed period.
In value terms, handbags with outer surface of leather, composition leather, or patent leather ($17.5B), handbags with outer surface of plastic sheeting or of textile materials ($14.8B) and cases and containers; trunks, suit-cases, vanity-cases, executive-cases, brief-cases, school satchels and similar containers, with outer surface of plastics or of textile materials ($8.9B) appeared to be the products with the highest levels of imports in 2024, together comprising 93% of global imports.
Handbags with outer surface of plastic sheeting or of textile materials, with a CAGR of +4.3%, recorded the highest rates of growth with regard to the value of imports, in terms of the main imported products over the period under review, while purchases for the other products experienced more modest paces of growth.
Import Prices By Type
In 2024, the average luggage import price amounted to $13 per unit, falling by -10% against the previous year. In general, import price indicated a perceptible expansion from 2013 to 2024: its price increased at an average annual rate of +2.7% over the last eleven-year period. The trend pattern, however, indicated some noticeable fluctuations being recorded throughout the analyzed period. The pace of growth appeared the most rapid in 2021 an increase of 267% against the previous year. Over the period under review, average import prices attained the peak figure at $14 per unit in 2023, and then contracted in the following year.
There were significant differences in the average prices amongst the major imported products. In 2024, the product with the highest price was handbags with outer surface of leather, composition leather, or patent leather ($107 per unit), while the price for travel sets; for personal toilet, sewing, shoe or clothes cleaning ($1 per unit) was amongst the lowest.
From 2013 to 2024, the most notable rate of growth in terms of prices was attained by cases and containers; trunks, suit-cases, vanity-cases, executive-cases, brief-cases, school satchels and similar containers, with outer surface of plastics or of textile materials (+5.4%), while the other products experienced more modest paces of growth.
Import Prices By Country
The average luggage import price stood at $13 per unit in 2024, waning by -10% against the previous year. In general, import price indicated moderate growth from 2013 to 2024: its price increased at an average annual rate of +2.7% over the last eleven-year period. The trend pattern, however, indicated some noticeable fluctuations being recorded throughout the analyzed period. The most prominent rate of growth was recorded in 2021 an increase of 267% against the previous year. Over the period under review, average import prices reached the maximum at $14 per unit in 2023, and then reduced in the following year.
Prices varied noticeably by country of destination: amid the top importers, the country with the highest price was France ($25 per unit), while India ($1 per unit) was amongst the lowest.
From 2013 to 2024, the most notable rate of growth in terms of prices was attained by Thailand (+7.8%), while the other global leaders experienced more modest paces of growth.
Exports
World’s Exports of Luggage And Handbags
In 2024, the amount of luggage and handbags exported worldwide expanded notably to 7.1B units, growing by 7.9% on the previous year’s figure. Overall, total exports indicated a modest increase from 2013 to 2024: its volume increased at an average annual rate of +1.6% over the last eleven years. The trend pattern, however, indicated some noticeable fluctuations being recorded throughout the analyzed period. Based on 2024 figures, exports increased by +58.5% against 2020 indices. The pace of growth appeared the most rapid in 2016 with an increase of 82%. As a result, the exports attained the peak of 9.8B units. From 2017 to 2024, the growth of the global exports remained at a lower figure.
In value terms, luggage exports declined to $56.7B in 2024. In general, total exports indicated a moderate expansion from 2013 to 2024: its value increased at an average annual rate of +3.3% over the last eleven-year period. The trend pattern, however, indicated some noticeable fluctuations being recorded throughout the analyzed period. Based on 2024 figures, exports increased by +54.6% against 2020 indices. The pace of growth was the most pronounced in 2021 when exports increased by 25%. Over the period under review, the global exports hit record highs at $59.5B in 2023, and then reduced in the following year.
Exports By Country
China prevails in exports structure, resulting at 5.4B units, which was approx. 77% of total exports in 2024. It was distantly followed by India (524M units), mixing up a 7.4% share of total exports. Saudi Arabia (196M units) and Vietnam (110M units) followed a long way behind the leaders.
China experienced a relatively flat trend pattern with regard to volume of exports of luggage and handbags. At the same time, Saudi Arabia (+76.7%), India (+12.0%) and Vietnam (+10.7%) displayed positive paces of growth. Moreover, Saudi Arabia emerged as the fastest-growing exporter exported in the world, with a CAGR of +76.7% from 2013-2024. While the share of India (+4.9 p.p.) and Saudi Arabia (+2.8 p.p.) increased significantly in terms of the global exports from 2013-2024, the share of China (-7.5 p.p.) displayed negative dynamics. The shares of the other countries remained relatively stable throughout the analyzed period.
In value terms, China ($21.4B) remains the largest luggage supplier worldwide, comprising 38% of global exports. The second position in the ranking was held by Vietnam ($1.5B), with a 2.6% share of global exports. It was followed by India, with a 1.9% share.
From 2013 to 2024, the average annual rate of growth in terms of value in China was relatively modest. In the other countries, the average annual rates were as follows: Vietnam (+4.8% per year) and India (+4.1% per year).
Exports By Type
Handbags with outer surface of plastic sheeting or of textile materials (3.2B units) and cases and containers; trunks, suit-cases, vanity-cases, executive-cases, brief-cases, school satchels and similar containers, with outer surface of plastics or of textile materials (2.8B units) dominates exports structure, together comprising 85% of total exports. It was distantly followed by travel sets; for personal toilet, sewing, shoe or clothes cleaning (686M units), constituting a 9.7% share of total exports. Handbags with outer surface of leather, composition leather, or patent leather (170M units) held a little share of total exports.
From 2013 to 2024, the most notable rate of growth in terms of shipments, amongst the leading exported products, was attained by cases and containers; trunks, suit-cases, vanity-cases, executive-cases, brief-cases, school satchels and similar containers, with outer surface of vulcanised fibre or of paperboard (with a CAGR of +4.6%), while the other products experienced more modest paces of growth.
In value terms, the largest types of exported luggage and handbags were handbags with outer surface of leather, composition leather, or patent leather ($19B), handbags with outer surface of plastic sheeting or of textile materials ($18.2B) and cases and containers; trunks, suit-cases, vanity-cases, executive-cases, brief-cases, school satchels and similar containers, with outer surface of plastics or of textile materials ($16.6B), together accounting for 95% of global exports. Cases and containers; trunks, suit-cases, vanity-cases, executive-cases, brief-cases, school satchels and similar containers, with outer surface of leather, of composition leather or of patent leather, handbags with outer surface of vulcanised fibre or of paperboard, cases and containers; trunks, suit-cases, vanity-cases, executive-cases, brief-cases, school satchels and similar containers, with outer surface of vulcanised fibre or of paperboard and travel sets; for personal toilet, sewing, shoe or clothes cleaning lagged somewhat behind, together comprising a further 5.2%.
Cases and containers; trunks, suit-cases, vanity-cases, executive-cases, brief-cases, school satchels and similar containers, with outer surface of vulcanised fibre or of paperboard, with a CAGR of +4.2%, saw the highest growth rate of the value of exports, in terms of the main exported products over the period under review, while shipments for the other products experienced more modest paces of growth.
Export Prices By Type
The average luggage export price stood at $8 per unit in 2024, waning by -11.7% against the previous year. In general, export price indicated a slight increase from 2013 to 2024: its price increased at an average annual rate of +1.7% over the last eleven-year period. The trend pattern, however, indicated some noticeable fluctuations being recorded throughout the analyzed period. The pace of growth appeared the most rapid in 2017 when the average export price increased by 94% against the previous year. The global export price peaked at $9.5 per unit in 2014; however, from 2015 to 2024, the export prices stood at a somewhat lower figure.
There were significant differences in the average prices amongst the major exported products. In 2024, the product with the highest price was handbags with outer surface of leather, composition leather, or patent leather ($112 per unit), while the average price for exports of travel sets; for personal toilet, sewing, shoe or clothes cleaning ($463 per thousand units) was amongst the lowest.
From 2013 to 2024, the most notable rate of growth in terms of prices was attained by handbags with outer surface of leather, composition leather, or patent leather (+7.7%), while the other products experienced more modest paces of growth.
Export Prices By Country
The average luggage export price stood at $8 per unit in 2024, dropping by -11.7% against the previous year. Over the period under review, export price indicated a mild increase from 2013 to 2024: its price increased at an average annual rate of +1.7% over the last eleven years. The trend pattern, however, indicated some noticeable fluctuations being recorded throughout the analyzed period. The growth pace was the most rapid in 2017 an increase of 94%. The global export price peaked at $9.5 per unit in 2014; however, from 2015 to 2024, the export prices stood at a somewhat lower figure.
Prices varied noticeably by country of origin: amid the top suppliers, the country with the highest price was Vietnam ($13 per unit), while Saudi Arabia ($98 per thousand units) was amongst the lowest.
From 2013 to 2024, the most notable rate of growth in terms of prices was attained by China (-0.1%), while the other global leaders experienced a decline in the export price figures.
Source: IndexBox Market Intelligence Platform
This post was originally published on this site be sure to check out more of their content.