
Feb 11, 2025
IndexBox has just published a new report: World – Luggage And Handbags – Market Analysis, Forecast, Size, Trends and Insights.
The luggage and handbags market is set to continue its upward consumption trend, with an estimated CAGR of +0.3% for volume and +2.9% for value from 2024 to 2030. This growth is fueled by rising demand worldwide, positioning the market to reach 5.6 billion units and $60.9 billion in value by the end of 2030.
Market Forecast
Driven by increasing demand for luggage and handbags worldwide, the market is expected to continue an upward consumption trend over the next six years. Market performance is forecast to retain its current trend pattern, expanding with an anticipated CAGR of +0.3% for the period from 2024 to 2030, which is projected to bring the market volume to 5.6B units by the end of 2030.
In value terms, the market is forecast to increase with an anticipated CAGR of +2.9% for the period from 2024 to 2030, which is projected to bring the market value to $60.9B (in nominal wholesale prices) by the end of 2030.

Consumption
World Consumption of Luggage And Handbags
In 2024, consumption of luggage and handbags increased by 5.6% to 5.5B units, rising for the fourth year in a row after two years of decline. Over the period under review, consumption saw a relatively flat trend pattern. The most prominent rate of growth was recorded in 2022 when the consumption volume increased by 9.4% against the previous year. Global consumption peaked in 2024 and is likely to see steady growth in years to come.
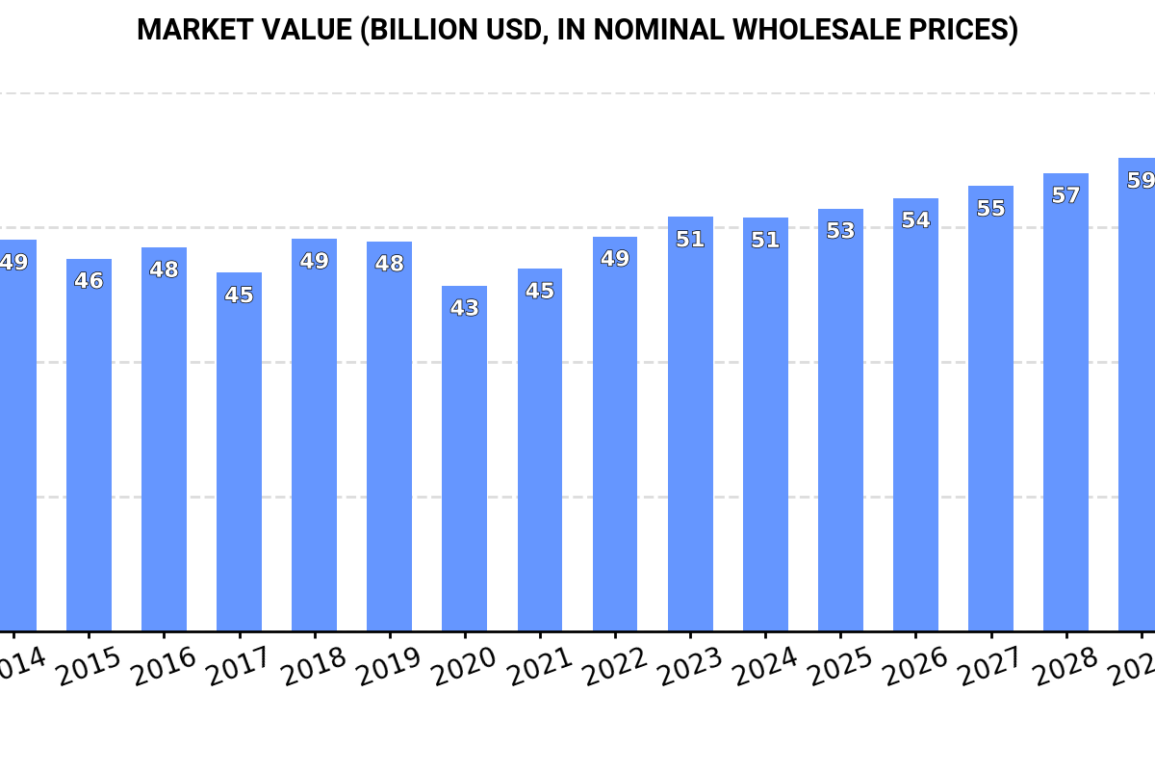
The global luggage market size dropped to $51.4B in 2024, approximately mirroring the previous year. This figure reflects the total revenues of producers and importers (excluding logistics costs, retail marketing costs, and retailers’ margins, which will be included in the final consumer price). Overall, consumption recorded a relatively flat trend pattern. The most prominent rate of growth was recorded in 2018 when the market value increased by 9.5%. Global consumption peaked at $51.5B in 2023, and then reduced in the following year.
Consumption By Country
The countries with the highest volumes of consumption in 2024 were China (748M units), India (401M units) and the United States (355M units), with a combined 27% share of global consumption. Brazil, the Netherlands, Mexico, Thailand, Italy, Pakistan and Saudi Arabia lagged somewhat behind, together comprising a further 19%.
From 2013 to 2024, the most notable rate of growth in terms of consumption, amongst the key consuming countries, was attained by the Netherlands (with a CAGR of +19.1%), while consumption for the other global leaders experienced more modest paces of growth.
In value terms, the United States ($4.9B), China ($2.6B) and the Netherlands ($1.9B) appeared to be the countries with the highest levels of market value in 2024, with a combined 18% share of the global market.
Among the main consuming countries, the Netherlands, with a CAGR of +19.7%, saw the highest rates of growth with regard to market size over the period under review, while market for the other global leaders experienced more modest paces of growth.
In 2024, the highest levels of luggage per capita consumption was registered in the Netherlands (10 units per person), followed by Saudi Arabia (3.1 units per person), Italy (2 units per person) and Thailand (2 units per person), while the world average per capita consumption of luggage was estimated at 0.7 units per person.
From 2013 to 2024, the average annual growth rate of the luggage per capita consumption in the Netherlands totaled +18.6%. The remaining consuming countries recorded the following average annual rates of per capita consumption growth: Saudi Arabia (+4.0% per year) and Italy (+0.1% per year).
Production
World Production of Luggage And Handbags
In 2024, global production of luggage and handbags rose slightly to 8.4B units, surging by 3.3% against the previous year’s figure. In general, production showed a relatively flat trend pattern. The pace of growth was the most pronounced in 2016 when the production volume increased by 60%. As a result, production reached the peak volume of 12B units. From 2017 to 2024, global production growth remained at a lower figure.
In value terms, luggage production reduced to $49.1B in 2024 estimated in export price. Over the period under review, production, however, continues to indicate a relatively flat trend pattern. The growth pace was the most rapid in 2016 when the production volume increased by 24%. As a result, production reached the peak level of $60.3B. From 2017 to 2024, global production growth failed to regain momentum.
Production By Country
China (6B units) constituted the country with the largest volume of luggage production, accounting for 71% of total volume. Moreover, luggage production in China exceeded the figures recorded by the second-largest producer, India (562M units), more than tenfold.
In China, luggage production remained relatively stable over the period from 2013-2024. In the other countries, the average annual rates were as follows: India (+4.5% per year) and Vietnam (+4.6% per year).
Imports
World Imports of Luggage And Handbags
In 2024, purchases abroad of luggage and handbags increased by 3.3% to 3.7B units, rising for the fourth year in a row after two years of decline. The total import volume increased at an average annual rate of +1.3% from 2013 to 2024; however, the trend pattern indicated some noticeable fluctuations being recorded throughout the analyzed period. The growth pace was the most rapid in 2021 with an increase of 28% against the previous year. Global imports peaked in 2024 and are likely to continue growth in the near future.
In value terms, luggage imports dropped to $46.2B in 2024. Overall, total imports indicated a tangible increase from 2013 to 2024: its value increased at an average annual rate of +4.0% over the last eleven-year period. The trend pattern, however, indicated some noticeable fluctuations being recorded throughout the analyzed period. Based on 2024 figures, imports increased by +51.0% against 2020 indices. The growth pace was the most rapid in 2021 with an increase of 25% against the previous year. Global imports peaked at $49.1B in 2023, and then fell in the following year.
Imports By Country
In 2024, the United States (382M units) and India (355M units) were the major importers of luggage and handbagsin the world, together achieving 20% of total imports. It was followed by the Netherlands (224M units) and Mexico (174M units), together comprising an 11% share of total imports. The following importers – Thailand (155M units), Italy (143M units), Brazil (131M units), Saudi Arabia (124M units), the UK (107M units) and Spain (106M units) – together made up 21% of total imports.
From 2013 to 2024, the biggest increases were recorded for India (with a CAGR of +21.3%), while purchases for the other global leaders experienced more modest paces of growth.
In value terms, the United States ($5.4B) constitutes the largest market for imported luggage and handbags worldwide, comprising 12% of global imports. The second position in the ranking was taken by the Netherlands ($2.4B), with a 5.1% share of global imports. It was followed by Italy, with a 4.6% share.
In the United States, luggage imports increased at an average annual rate of +2.2% over the period from 2013-2024. The remaining importing countries recorded the following average annual rates of imports growth: the Netherlands (+14.8% per year) and Italy (+2.9% per year).
Imports By Type
Handbags with outer surface of plastic sheeting or of textile materials was the major type of luggage and handbags in the world, with the volume of imports finishing at 1.8B units, which was approx. 49% of total imports in 2024. Cases and containers; trunks, suit-cases, vanity-cases, executive-cases, brief-cases, school satchels and similar containers, with outer surface of plastics or of textile materials (727M units) ranks second in terms of the total imports with a 20% share, followed by travel sets; for personal toilet, sewing, shoe or clothes cleaning (14%) and handbags with outer surface of vulcanised fibre or of paperboard (8.6%). Handbags with outer surface of leather, composition leather, or patent leather (156M units) and cases and containers; trunks, suit-cases, vanity-cases, executive-cases, brief-cases, school satchels and similar containers, with outer surface of vulcanised fibre or of paperboard (110M units) followed a long way behind the leaders.
Imports of handbags with outer surface of plastic sheeting or of textile materials increased at an average annual rate of +1.5% from 2013 to 2024. At the same time, handbags with outer surface of vulcanised fibre or of paperboard (+6.5%), travel sets; for personal toilet, sewing, shoe or clothes cleaning (+5.0%) and cases and containers; trunks, suit-cases, vanity-cases, executive-cases, brief-cases, school satchels and similar containers, with outer surface of vulcanised fibre or of paperboard (+4.4%) displayed positive paces of growth. Moreover, handbags with outer surface of vulcanised fibre or of paperboard emerged as the fastest-growing type imported in the world, with a CAGR of +6.5% from 2013-2024. By contrast, cases and containers; trunks, suit-cases, vanity-cases, executive-cases, brief-cases, school satchels and similar containers, with outer surface of plastics or of textile materials (-1.7%) and handbags with outer surface of leather, composition leather, or patent leather (-1.8%) illustrated a downward trend over the same period. While the share of travel sets; for personal toilet, sewing, shoe or clothes cleaning (+4.7 p.p.) and handbags with outer surface of vulcanised fibre or of paperboard (+3.6 p.p.) increased significantly in terms of the global imports from 2013-2024, the share of handbags with outer surface of leather, composition leather, or patent leather (-1.7 p.p.) and cases and containers; trunks, suit-cases, vanity-cases, executive-cases, brief-cases, school satchels and similar containers, with outer surface of plastics or of textile materials (-7.8 p.p.) displayed negative dynamics. The shares of the other products remained relatively stable throughout the analyzed period.
In value terms, handbags with outer surface of leather, composition leather, or patent leather ($18.2B), handbags with outer surface of plastic sheeting or of textile materials ($15.1B) and cases and containers; trunks, suit-cases, vanity-cases, executive-cases, brief-cases, school satchels and similar containers, with outer surface of plastics or of textile materials ($9.6B) appeared to be the products with the highest levels of imports in 2024, together accounting for 93% of global imports. Handbags with outer surface of vulcanised fibre or of paperboard, cases and containers; trunks, suit-cases, vanity-cases, executive-cases, brief-cases, school satchels and similar containers, with outer surface of leather, of composition leather or of patent leather, cases and containers; trunks, suit-cases, vanity-cases, executive-cases, brief-cases, school satchels and similar containers, with outer surface of vulcanised fibre or of paperboard and travel sets; for personal toilet, sewing, shoe or clothes cleaning lagged somewhat behind, together accounting for a further 6.9%.
Travel sets; for personal toilet, sewing, shoe or clothes cleaning, with a CAGR of +5.6%, saw the highest growth rate of the value of imports, in terms of the main imported products over the period under review, while purchases for the other products experienced more modest paces of growth.
Import Prices By Type
In 2024, the average luggage import price amounted to $13 per unit, which is down by -8.9% against the previous year. Over the last eleven years, it increased at an average annual rate of +2.6%. The most prominent rate of growth was recorded in 2014 when the average import price increased by 15%. Over the period under review, average import prices reached the maximum at $14 per unit in 2020; however, from 2021 to 2024, import prices failed to regain momentum.
There were significant differences in the average prices amongst the major imported products. In 2024, the product with the highest price was handbags with outer surface of leather, composition leather, or patent leather ($116 per unit), while the price for travel sets; for personal toilet, sewing, shoe or clothes cleaning ($930 per thousand units) was amongst the lowest.
From 2013 to 2024, the most notable rate of growth in terms of prices was attained by handbags with outer surface of leather, composition leather, or patent leather (+6.0%), while the other products experienced more modest paces of growth.
Import Prices By Country
In 2024, the average luggage import price amounted to $13 per unit, with a decrease of -8.9% against the previous year. Over the last eleven years, it increased at an average annual rate of +2.6%. The pace of growth was the most pronounced in 2014 an increase of 15%. Over the period under review, average import prices reached the peak figure at $14 per unit in 2020; however, from 2021 to 2024, import prices stood at a somewhat lower figure.
There were significant differences in the average prices amongst the major importing countries. In 2024, amid the top importers, the country with the highest price was the UK ($17 per unit), while India ($1 per unit) was amongst the lowest.
From 2013 to 2024, the most notable rate of growth in terms of prices was attained by Mexico (+8.1%), while the other global leaders experienced more modest paces of growth.
Exports
World Exports of Luggage And Handbags
For the fourth consecutive year, the global market recorded growth in overseas shipments of luggage and handbags, which increased by 1.5% to 6.6B units in 2024. Overall, total exports indicated a modest increase from 2013 to 2024: its volume increased at an average annual rate of +1.0% over the last eleven years. The trend pattern, however, indicated some noticeable fluctuations being recorded throughout the analyzed period. Based on 2024 figures, exports increased by +49.3% against 2020 indices. The pace of growth appeared the most rapid in 2016 when exports increased by 84%. As a result, the exports reached the peak of 9.8B units. From 2017 to 2024, the growth of the global exports remained at a somewhat lower figure.
In value terms, luggage exports fell to $55.8B in 2024. In general, total exports indicated perceptible growth from 2013 to 2024: its value increased at an average annual rate of +3.2% over the last eleven years. The trend pattern, however, indicated some noticeable fluctuations being recorded throughout the analyzed period. Based on 2024 figures, exports increased by +53.1% against 2020 indices. The most prominent rate of growth was recorded in 2021 with an increase of 25%. Over the period under review, the global exports reached the maximum at $59.2B in 2023, and then contracted in the following year.
Exports By Country
China dominates exports structure, recording 5.3B units, which was approx. 79% of total exports in 2024. It was distantly followed by India (516M units), committing a 7.8% share of total exports. Vietnam (115M units) held a little share of total exports.
China experienced a relatively flat trend pattern with regard to volume of exports of luggage and handbags. At the same time, India (+12.1%) and Vietnam (+11.6%) displayed positive paces of growth. Moreover, India emerged as the fastest-growing exporter exported in the world, with a CAGR of +12.1% from 2013-2024. While the share of India (+5.3 p.p.) increased significantly in terms of the global exports from 2013-2024, the share of China (-5.1 p.p.) displayed negative dynamics. The shares of the other countries remained relatively stable throughout the analyzed period.
In value terms, China ($20.7B) remains the largest luggage supplier worldwide, comprising 37% of global exports. The second position in the ranking was taken by Vietnam ($1.4B), with a 2.6% share of global exports.
In China, luggage exports remained relatively stable over the period from 2013-2024. In the other countries, the average annual rates were as follows: Vietnam (+4.6% per year) and India (+3.8% per year).
Exports By Type
Handbags with outer surface of plastic sheeting or of textile materials (3.1B units) and cases and containers; trunks, suit-cases, vanity-cases, executive-cases, brief-cases, school satchels and similar containers, with outer surface of plastics or of textile materials (2.8B units) prevails in exports structure, together comprising 88% of total exports. It was distantly followed by travel sets; for personal toilet, sewing, shoe or clothes cleaning (502M units), comprising a 7.6% share of total exports. Handbags with outer surface of leather, composition leather, or patent leather (149M units) held a minor share of total exports.
From 2013 to 2024, the biggest increases were recorded for cases and containers; trunks, suit-cases, vanity-cases, executive-cases, brief-cases, school satchels and similar containers, with outer surface of plastics or of textile materials (with a CAGR of +1.9%), while shipments for the other products experienced more modest paces of growth.
In value terms, handbags with outer surface of leather, composition leather, or patent leather ($19.4B), handbags with outer surface of plastic sheeting or of textile materials ($17.3B) and cases and containers; trunks, suit-cases, vanity-cases, executive-cases, brief-cases, school satchels and similar containers, with outer surface of plastics or of textile materials ($16.2B) were the products with the highest levels of exports in 2024, together accounting for 95% of global exports. Cases and containers; trunks, suit-cases, vanity-cases, executive-cases, brief-cases, school satchels and similar containers, with outer surface of leather, of composition leather or of patent leather, handbags with outer surface of vulcanised fibre or of paperboard, cases and containers; trunks, suit-cases, vanity-cases, executive-cases, brief-cases, school satchels and similar containers, with outer surface of vulcanised fibre or of paperboard and travel sets; for personal toilet, sewing, shoe or clothes cleaning lagged somewhat behind, together accounting for a further 5.3%.
Cases and containers; trunks, suit-cases, vanity-cases, executive-cases, brief-cases, school satchels and similar containers, with outer surface of vulcanised fibre or of paperboard, with a CAGR of +4.3%, recorded the highest rates of growth with regard to the value of exports, among the main exported products over the period under review, while shipments for the other products experienced more modest paces of growth.
Export Prices By Type
In 2024, the average luggage export price amounted to $8.4 per unit, falling by -7.1% against the previous year. Overall, export price indicated a notable increase from 2013 to 2024: its price increased at an average annual rate of +2.1% over the last eleven years. The trend pattern, however, indicated some noticeable fluctuations being recorded throughout the analyzed period. The most prominent rate of growth was recorded in 2017 an increase of 94%. The global export price peaked at $9.5 per unit in 2014; however, from 2015 to 2024, the export prices remained at a lower figure.
Prices varied noticeably by the product type; the product with the highest price was handbags with outer surface of leather, composition leather, or patent leather ($130 per unit), while the average price for exports of travel sets; for personal toilet, sewing, shoe or clothes cleaning ($623 per thousand units) was amongst the lowest.
From 2013 to 2024, the most notable rate of growth in terms of prices was attained by handbags with outer surface of leather, composition leather, or patent leather (+9.2%), while the other products experienced more modest paces of growth.
Export Prices By Country
In 2024, the average luggage export price amounted to $8.4 per unit, dropping by -7.1% against the previous year. In general, export price indicated a perceptible increase from 2013 to 2024: its price increased at an average annual rate of +2.1% over the last eleven-year period. The trend pattern, however, indicated some noticeable fluctuations being recorded throughout the analyzed period. The most prominent rate of growth was recorded in 2017 when the average export price increased by 94%. Over the period under review, the average export prices hit record highs at $9.5 per unit in 2014; however, from 2015 to 2024, the export prices stood at a somewhat lower figure.
Prices varied noticeably by country of origin: amid the top suppliers, the country with the highest price was Vietnam ($12 per unit), while India ($2 per unit) was amongst the lowest.
From 2013 to 2024, the most notable rate of growth in terms of prices was attained by China (-0.1%), while the other global leaders experienced a decline in the export price figures.
Source: IndexBox Market Intelligence Platform
This post was originally published on this site be sure to check out more of their content.