
Feb 19, 2025
IndexBox has just published a new report: World – Handbags – Market Analysis, Forecast, Size, Trends And Insights.
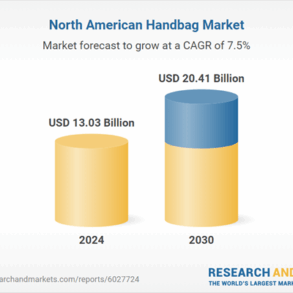
The handbag market is projected to experience a decline in both volume and value over the period from 2024 to 2030. Despite an expected decrease in market performance, the value of the market is predicted to contract at a slower rate compared to the volume, resulting in a decrease in market volume to 3.5B units by 2030 and a market value of $41.1B.
Market Forecast
The handbag market is expected to start a downward consumption trend over the next six-year period. The performance of the market is forecast to decrease slightly, with an anticipated CAGR of -0.6% for the six-year period from 2024 to 2030, which is projected to depress the market volume to 3.5B units by the end of 2030.
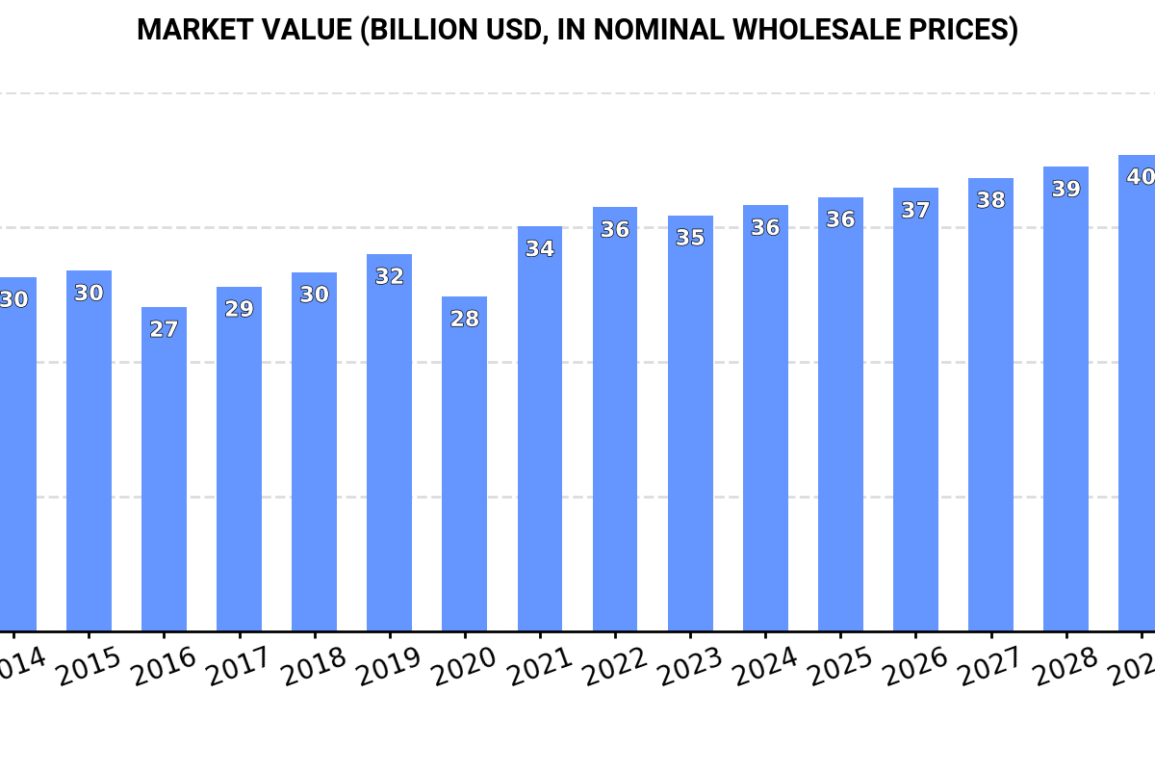
In value terms, the market is forecast to contract with an anticipated CAGR of +2.4% for the period from 2024 to 2030, which is projected to bring the market value to $41.1B (in nominal wholesale prices) by the end of 2030.

Consumption
World Consumption of Handbags
In 2024, the amount of handbags consumed worldwide expanded notably to 3.6B units, increasing by 8.6% against the previous year. Overall, consumption recorded a relatively flat trend pattern. As a result, consumption attained the peak volume of 3.7B units. From 2023 to 2024, the growth of the global consumption failed to regain momentum.
The global handbag market revenue reached $35.7B in 2024, increasing by 2.4% against the previous year. This figure reflects the total revenues of producers and importers (excluding logistics costs, retail marketing costs, and retailers’ margins, which will be included in the final consumer price). In general, consumption continues to indicate a relatively flat trend pattern. Over the period under review, the global market attained the maximum level in 2024 and is likely to see gradual growth in years to come.
Consumption By Country
The countries with the highest volumes of consumption in 2024 were China (654M units), India (443M units) and the United States (247M units), with a combined 37% share of global consumption. Indonesia, the Netherlands, Pakistan, Mexico, Italy, Brazil and the UK lagged somewhat behind, together comprising a further 23%.
From 2013 to 2024, the most notable rate of growth in terms of consumption, amongst the main consuming countries, was attained by the Netherlands (with a CAGR of +18.6%), while consumption for the other global leaders experienced more modest paces of growth.
In value terms, the largest handbag markets worldwide were the United States ($3.8B), China ($2.2B) and Italy ($1.5B), together comprising 21% of the global market. The Netherlands, the UK, Pakistan, Indonesia, Mexico, India and Brazil lagged somewhat behind, together accounting for a further 14%.
The Netherlands, with a CAGR of +17.1%, saw the highest growth rate of market size among the main consuming countries over the period under review, while market for the other global leaders experienced more modest paces of growth.
In 2024, the highest levels of handbag per capita consumption was registered in the Netherlands (7.9 units per person), followed by Italy (1.8 units per person), the UK (1.2 units per person) and Mexico (0.9 units per person), while the world average per capita consumption of handbag was estimated at 0.4 units per person.
From 2013 to 2024, the average annual rate of growth in terms of the handbag per capita consumption in the Netherlands totaled +18.2%. The remaining consuming countries recorded the following average annual rates of per capita consumption growth: Italy (+2.5% per year) and the UK (-0.8% per year).
Production
World Production of Handbags
Global handbag production expanded modestly to 4.6B units in 2024, with an increase of 3.3% on 2023 figures. In general, production saw a relatively flat trend pattern. The pace of growth was the most pronounced in 2016 with an increase of 104%. As a result, production reached the peak volume of 8.5B units. From 2017 to 2024, global production growth failed to regain momentum.
In value terms, handbag production shrank modestly to $30.5B in 2024 estimated in export price. The total output value increased at an average annual rate of +2.0% from 2013 to 2024; however, the trend pattern indicated some noticeable fluctuations being recorded in certain years. The most prominent rate of growth was recorded in 2016 when the production volume increased by 40% against the previous year. As a result, production reached the peak level of $34.7B. From 2017 to 2024, global production growth failed to regain momentum.
Production By Country
China (2.9B units) constituted the country with the largest volume of handbag production, comprising approx. 62% of total volume. Moreover, handbag production in China exceeded the figures recorded by the second-largest producer, India (628M units), fivefold. Vietnam (164M units) ranked third in terms of total production with a 3.6% share.
From 2013 to 2024, the average annual rate of growth in terms of volume in China stood at -1.6%. In the other countries, the average annual rates were as follows: India (+5.6% per year) and Vietnam (+10.9% per year).
Imports
World Imports of Handbags
In 2024, the amount of handbags imported worldwide rose remarkably to 2.3B units, increasing by 11% on 2023 figures. The total import volume increased at an average annual rate of +1.8% over the period from 2013 to 2024; however, the trend pattern indicated some noticeable fluctuations being recorded throughout the analyzed period. The most prominent rate of growth was recorded in 2021 when imports increased by 31%. Over the period under review, global imports reached the maximum in 2024 and are expected to retain growth in the immediate term.
In value terms, handbag imports dropped to $34.3B in 2024. Over the period under review, total imports indicated a measured increase from 2013 to 2024: its value increased at an average annual rate of +4.3% over the last eleven-year period. The trend pattern, however, indicated some noticeable fluctuations being recorded throughout the analyzed period. The pace of growth appeared the most rapid in 2021 with an increase of 29%. Global imports peaked at $37.2B in 2023, and then declined in the following year.
Imports By Country
India (320M units) and the United States (246M units) represented the largest importers of handbags in 2024, reaching approx. 14% and 11% of total imports, respectively. It was followed by the Netherlands (163M units), Italy (127M units) and Mexico (118M units), together creating an 18% share of total imports. Brazil (98M units), Spain (86M units), the UK (84M units), Thailand (81M units) and Chile (76M units) followed a long way behind the leaders.
From 2013 to 2024, the most notable rate of growth in terms of purchases, amongst the key importing countries, was attained by India (with a CAGR of +24.4%), while imports for the other global leaders experienced more modest paces of growth.
In value terms, the United States ($3.9B) constitutes the largest market for imported handbags worldwide, comprising 11% of global imports. The second position in the ranking was taken by Italy ($1.8B), with a 5.3% share of global imports. It was followed by the Netherlands, with a 4.1% share.
In the United States, handbag imports increased at an average annual rate of +2.2% over the period from 2013-2024. In the other countries, the average annual rates were as follows: Italy (+3.4% per year) and the Netherlands (+15.2% per year).
Imports By Type
Handbags with outer surface of plastic sheeting or of textile materials was the main imported product with an import of about 1.8B units, which accounted for 79% of total imports. Handbags with outer surface of vulcanised fibre or of paperboard (317M units) took a 14% share (based on physical terms) of total imports, which put it in second place, followed by handbags with outer surface of leather, composition leather, or patent leather (6.9%).
Imports of handbags with outer surface of plastic sheeting or of textile materials increased at an average annual rate of +1.5% from 2013 to 2024. At the same time, handbags with outer surface of vulcanised fibre or of paperboard (+6.5%) displayed positive paces of growth. Moreover, handbags with outer surface of vulcanised fibre or of paperboard emerged as the fastest-growing type imported in the world, with a CAGR of +6.5% from 2013-2024. By contrast, handbags with outer surface of leather, composition leather, or patent leather (-1.8%) illustrated a downward trend over the same period. While the share of handbags with outer surface of vulcanised fibre or of paperboard (+5.4 p.p.) increased significantly in terms of the global imports from 2013-2024, the share of handbags with outer surface of plastic sheeting or of textile materials (-2.2 p.p.) and handbags with outer surface of leather, composition leather, or patent leather (-3.2 p.p.) displayed negative dynamics.
In value terms, the largest types of imported handbags were handbags with outer surface of leather, composition leather, or patent leather ($18.2B), handbags with outer surface of plastic sheeting or of textile materials ($15.1B) and handbags with outer surface of vulcanised fibre or of paperboard ($998M).
In terms of the main imported products, handbags with outer surface of plastic sheeting or of textile materials, with a CAGR of +4.5%, saw the highest rates of growth with regard to the value of imports, over the period under review, while purchases for the other products experienced more modest paces of growth.
Import Prices By Type
The average handbag import price stood at $15 per unit in 2024, shrinking by -16.6% against the previous year. In general, import price indicated notable growth from 2013 to 2024: its price increased at an average annual rate of +2.5% over the last eleven years. The trend pattern, however, indicated some noticeable fluctuations being recorded throughout the analyzed period. The most prominent rate of growth was recorded in 2020 when the average import price increased by 20% against the previous year. Global import price peaked at $18 per unit in 2023, and then declined markedly in the following year.
There were significant differences in the average prices amongst the major imported products. In 2024, the product with the highest price was handbags with outer surface of leather, composition leather, or patent leather ($116 per unit), while the price for handbags with outer surface of vulcanised fibre or of paperboard ($3.2 per unit) was amongst the lowest.
From 2013 to 2024, the most notable rate of growth in terms of prices was attained by handbags with outer surface of leather, composition leather, or patent leather (+6.0%), while the other products experienced mixed trends in the import price figures.
Import Prices By Country
In 2024, the average handbag import price amounted to $15 per unit, reducing by -16.6% against the previous year. Over the period under review, import price indicated a perceptible expansion from 2013 to 2024: its price increased at an average annual rate of +2.5% over the last eleven-year period. The trend pattern, however, indicated some noticeable fluctuations being recorded throughout the analyzed period. The most prominent rate of growth was recorded in 2020 an increase of 20% against the previous year. Over the period under review, average import prices hit record highs at $18 per unit in 2023, and then contracted markedly in the following year.
There were significant differences in the average prices amongst the major importing countries. In 2024, amid the top importers, the country with the highest price was the United States ($16 per unit), while India ($538 per thousand units) was amongst the lowest.
From 2013 to 2024, the most notable rate of growth in terms of prices was attained by Spain (+8.3%), while the other global leaders experienced more modest paces of growth.
Exports
World Exports of Handbags
In 2024, approx. 3.3B units of handbags were exported worldwide; increasing by 2.7% compared with the previous year. Over the period under review, exports continue to indicate a relatively flat trend pattern. The most prominent rate of growth was recorded in 2016 with an increase of 153%. As a result, the exports reached the peak of 7.3B units. From 2017 to 2024, the growth of the global exports failed to regain momentum.
In value terms, handbag exports fell slightly to $37.6B in 2024. Overall, total exports indicated notable growth from 2013 to 2024: its value increased at an average annual rate of +3.9% over the last eleven-year period. The trend pattern, however, indicated some noticeable fluctuations being recorded throughout the analyzed period. Based on 2024 figures, exports increased by +41.3% against 2020 indices. The growth pace was the most rapid in 2021 with an increase of 25% against the previous year. Over the period under review, the global exports hit record highs at $38.8B in 2023, and then fell slightly in the following year.
Exports By Country
China was the key exporting country with an export of about 2.2B units, which resulted at 68% of total exports. It was distantly followed by India (505M units), committing a 15% share of total exports. The following exporters – Vietnam (108M units), Cambodia (53M units) and Italy (51M units) – together made up 6.4% of total exports.
Exports from China decreased at an average annual rate of -1.2% from 2013 to 2024. At the same time, Cambodia (+38.8%), Vietnam (+16.7%), India (+12.2%) and Italy (+2.7%) displayed positive paces of growth. Moreover, Cambodia emerged as the fastest-growing exporter exported in the world, with a CAGR of +38.8% from 2013-2024. From 2013 to 2024, the share of India, Vietnam and Cambodia increased by +11, +2.6 and +1.6 percentage points, respectively. The shares of the other countries remained relatively stable throughout the analyzed period.
In value terms, the largest handbag supplying countries worldwide were Italy ($9.6B), China ($7.3B) and Vietnam ($1.2B), together comprising 48% of global exports. India and Cambodia lagged somewhat behind, together accounting for a further 3.5%.
Cambodia, with a CAGR of +43.1%, recorded the highest growth rate of the value of exports, among the main exporting countries over the period under review, while shipments for the other global leaders experienced more modest paces of growth.
Exports By Type
Handbags with outer surface of plastic sheeting or of textile materials prevails in exports structure, reaching 3.1B units, which was near 93% of total exports in 2024. It was distantly followed by handbags with outer surface of leather, composition leather, or patent leather (149M units), making up a 4.5% share of total exports. Handbags with outer surface of vulcanised fibre or of paperboard (85M units) followed a long way behind the leaders.
Handbags with outer surface of plastic sheeting or of textile materials experienced a relatively flat trend pattern with regard to volume of exports. Handbags with outer surface of vulcanised fibre or of paperboard experienced a relatively flat trend pattern. handbags with outer surface of leather, composition leather, or patent leather (-4.5%) illustrated a downward trend over the same period. From 2013 to 2024, the share of handbags with outer surface of plastic sheeting or of textile materials increased by +3.8 percentage points. The shares of the other products remained relatively stable throughout the analyzed period.
In value terms, the largest types of exported handbags were handbags with outer surface of leather, composition leather, or patent leather ($19.4B), handbags with outer surface of plastic sheeting or of textile materials ($17.3B) and handbags with outer surface of vulcanised fibre or of paperboard ($1B).
Among the main exported products, handbags with outer surface of leather, composition leather, or patent leather, with a CAGR of +4.3%, saw the highest growth rate of the value of exports, over the period under review, while shipments for the other products experienced more modest paces of growth.
Export Prices By Type
The average handbag export price stood at $11 per unit in 2024, dropping by -5.5% against the previous year. Overall, export price indicated a tangible expansion from 2013 to 2024: its price increased at an average annual rate of +3.2% over the last eleven-year period. The trend pattern, however, indicated some noticeable fluctuations being recorded throughout the analyzed period. The pace of growth appeared the most rapid in 2017 an increase of 160% against the previous year. The global export price peaked at $12 per unit in 2023, and then reduced in the following year.
Prices varied noticeably by the product type; the product with the highest price was handbags with outer surface of leather, composition leather, or patent leather ($130 per unit), while the average price for exports of handbags with outer surface of plastic sheeting or of textile materials ($5.6 per unit) was amongst the lowest.
From 2013 to 2024, the most notable rate of growth in terms of prices was attained by handbags with outer surface of leather, composition leather, or patent leather (+9.2%), while the other products experienced more modest paces of growth.
Export Prices By Country
The average handbag export price stood at $11 per unit in 2024, falling by -5.5% against the previous year. Over the period under review, export price indicated perceptible growth from 2013 to 2024: its price increased at an average annual rate of +3.2% over the last eleven-year period. The trend pattern, however, indicated some noticeable fluctuations being recorded throughout the analyzed period. The most prominent rate of growth was recorded in 2017 when the average export price increased by 160%. Over the period under review, the average export prices reached the maximum at $12 per unit in 2023, and then dropped in the following year.
Prices varied noticeably by country of origin: amid the top suppliers, the country with the highest price was Italy ($187 per unit), while India ($1.8 per unit) was amongst the lowest.
From 2013 to 2024, the most notable rate of growth in terms of prices was attained by Italy (+3.7%), while the other global leaders experienced mixed trends in the export price figures.
Source: IndexBox Market Intelligence Platform
This post was originally published on this site be sure to check out more of their content.