


Abstract
The prevalence of obesity in dogs is increasing worldwide. This study evaluated the effects of a mixed probiotic formula on the weight, body condition score (BCS), blood metabolite profiles, and gut microbiota of overweight and obese dogs over a 12-week supplementation period to determine the anti-obesity effects of Lactiplantibacillus plantarum CBT LP3 and Bifidobacterium breve CBT BR3. This was a community-based, randomized study that sampled 41 overweight and obese dogs with a veterinarian-determined BCS of 6 or more. The physical activity of all the subjects was measured using a pedometer designed exclusively for dogs. The food intake was measured using the developed application. Only the treatment group received the mixed probiotic formula twice daily (3 g per dose). A significant decrease in body weight (p < 0.0001), BCS (p < 0.0001), serum TG (p < 0.0001), serum TC (p = 0.0400), and serum leptin (p = 0.0252), and a significantly increased serum adiponectin levels (p = 0.0007) were observed in the treatment group compared with the values in the control group. Microbiota analysis showed that Lactiplantibacillus increased and Erysipelatoclostridium, Staphylococcus, and Gemella decreased more significantly in the treatment group than in the control group. These results suggested that Lactiplantibacillus plantarum CBT LP3 and Bifidobacterium breve CBT BR3 may be effective in alleviating obesity in dogs.
Introduction
Overweightness and obesity in dogs have been reported to cause a range of health concerns, including chronic inflammatory conditions, elevated risk of diabetes, and hypertension, orthopedic conditions such as patellar luxation, increased risk of heart-related conditions, and increased risk of urological problems1,2,3,4,5,6. Globally, overweight and obese dogs account for 34–63% of the total number of dogs1,2,5, and the ratio is increasing every year7. Obesity-induced diseases in dogs can increase healthcare costs, which can be a significant burden for dog owners8. Known risk factors for overweight and obesity in dogs include an imbalance between food intake and energy consumption, medical conditions (e.g., hypothyroidism), genetic factors, breed (e.g., Labrador Retriever, Cocker Spaniel, Beagle, etc.), spay/neuter status, sex, living environment, and age9,10.
Obesity in dogs is measured using various techniques, including body condition score (BCS), body weight, electrical impedance, X-ray absorptiometry, ultrasound, and magnetic resonance imaging (MRI)9. BCS and body weight measurement are the two most popular methods owing to their cost-effectiveness and convenience. BCS is a subjective and semiquantitative method for measuring body composition, and there are 5-point scale, 7-point scale, and 9-point scale methods11,12,13. Among them, the 9-point scale method is the most widely used11,12,13. BCS is a subjective visual and tactile assessment of subcutaneous fat, abdominal fat, ribs, vertebrae, and back muscles9. There is no significant difference in BCS measurements between non-experts, such as dog owners, and trained experts9,13. Therefore, non-experts can perform BCS measurements9,13. On the 9-point BCS scale, 4–5, 6–7, and 8–9 points indicate normal, overweight, and obese weight categories, respectively14,15. A higher BCS point is associated with a reduced life expectancy in dogs16. Several studies have shown that the longer a dog is on a weight loss program, the more difficult it is to lose weight17,18. So, most veterinarians recommend losing about 1% of body weight per week in the early stages (about 2–3 months) of weight loss19.
Several studies have revealed the effect of diet on the gut microbiota of dogs, which is linked to obesity-related metabolism20,21,22,23,24. An unhealthy diet causes an imbalance in the gut microbiota, which in turn promotes the overgrowth of pathogenic organisms resulting in obesity25,26,27. In contrast, a balanced gut microbiota, which can be achieved through a healthy diet, may prevent or mitigate obesity28,29. A substantial difference was observed in the gut microbiota of obese and non-obese dogs23. Obese dogs exhibit markedly lower diversity of gut microbiota23.
Probiotics, a generic term denoting a variety of beneficial bacteria, control obesity by modulating the mechanisms associated with body weight, gut microbiota, and inflammation30,31,32,33. When five Lactobacillus strains were fed to C57BL/6J mice with obesity induced by a high-fat diet, they alleviated obesity by regulating lipid metabolism mitigating fat accumulation and reducing total cholesterol (TC), triglyceride (TG), low-density lipoprotein (LDL), and leptin levels, while increasing high-density lipoprotein (HDL) and adiponectin levels in serum31.
Lactiplantibacillus plantarum is found in dairy products and various fermented products such as kimchi34, and Bifidobacterium breve is commonly isolated from the gut of healthy breastfed infants and breast milk35. Lactiplantibacillus plantarum and Bifidobacterium breve are two representative probiotics that have long been known to be safe and are available in a variety of commercial products36,37,38,39,40. Many clinical studies in humans showed their benefits in improving immune, enhancing gut health, and preventing obesity36,37,38,39,40.
When mouse models of high-fat diet-induced obesity were fed Lactiplantibacillus plantarum, their body weight decreased41, blood TG concentrations decreased26, and insulin sensitivity improved (determined based on the lower fasting blood glucose level and fructosamine concentrations in serum)42. more than their values in the control group. Moreover, when they were fed Bifidobacterium breve, their body weight, blood TC concentrations, and fasting blood glucose levels decreased43.
However, to date, no studies have reported a mixed probiotic formula containing Lactiplantibacillus plantarum and Bifidobacterium breve for the management of obesity in dogs. Because Lactiplantibacillus plantarum and Bifidobacterium breve have been proven to have potential effects on obesity prevention in humans and mouse models, they may be a meaningful option for the management of obesity in dogs.
The objective of this study was to evaluate the anti-obesity effects of a mixed probiotic formula containing Lactiplantibacillus plantarum CBT LP3 and Bifidobacterium breve CBT BR3 on overweight and obese dog models. To achieve this objective, this study analyzed the effects of supplementation with Lactiplantibacillus plantarum CBT LP3 and Bifidobacterium breve CBT BR3 on the body weight, BCS, serum biochemistry, and gut microbiota of overweight and obese dogs.
Materials and methods
Ethics statement
This study was approved by the Gachon University Institutional Animal Care and Use Committee (IACUC approved No. GU1-2023-IA0037-00), and all researchers complied with all animal care and other protocols. The study was carried out from July 4 to November 30, 2023. Clinical questionnaires were also provided to dog owners after obtaining approval from the Gachon University Institutional Review Board (IRB approved No. 1044396-202306-HR-089-01).
Study design
We designed a community-based, randomized, open-label trial to examine the anti-obesity effects of a mixed probiotic formula containing Lactiplantibacillus plantarum CBT LP3 and Bifidobacterium breve CBT BR3. Overweight and obese dogs with a BCS of 6 or higher, determined by a veterinarian, were recruited, and randomly assigned to treatment and control groups. Randomization lists were computer-generated by researchers who had no contact with owners. The quantity of physical activity in dogs was automatically recorded using a pedometer (Pevo, DDCares Co., Seongnam-si, Republic of Korea). The owners were also asked to record their dogs’ daily food intake using the developed mobile application. The treatment group was administered the probiotic formula and collected the same physical activity and daily food intake information as the control group. The food intake was first quantified on a dedicated feed scale before feeding and the precise amount was entered into the mobile application. All the target dogs maintain their usual food and physical activity regimens throughout the study period. The treatment period was 12 weeks.
Prior to commencement of the study, the purpose of the study and the protocol were explained to the dog owners, and written informed consent was obtained. All dogs were fasted for 12 h prior to the Week 0 examination. The Week 0 examination included baseline characteristics (e.g., breed, age, sex, and spay/neuter status), physical examination (e.g., weight and BCS 9-point scale), vital signs (e.g., heart rate, respiratory rate, and body temperature), owner-administered obesity-related clinical questionnaires (e.g., food intake and physical activity), serum biochemistry, and feces sampling. The items of the Week 12 examination were the same as those of the Week 0 examination except for baseline characteristics (Fig. 1). To evaluate the effectiveness of probiotics, dogs that had taken a probiotic product in the last 3 months or had serious medical conditions other than obesity were excluded.

Diagram of the clinical trial.
Subjects.
We estimated the minimum sample size using power calculations, with a significance level of P = 0.05 and a power of 80%. The estimated minimum sample size for each group was 15 dogs44. We aimed to recruit 40 dogs (20 dogs per group), with an estimated dropout rate of 15%. This study recruited 52 overweight and obese dogs owned by individuals with a veterinarian determined BCS of 6 or higher and a history of visiting a local veterinary clinic (Table 1).
Probiotics supplementation and food intake
The probiotic formula used in this study was manufactured by Cell Biotech (Gimpo-si, Republic of Korea), and a mixed microtablet product containing 2.5 × 10⁹ CFU/day of Lactiplantibacillus plantarum CBT LP3 (KCTC 10782BP) and 2.5 × 10⁹ CFU/day of Bifidobacterium breve CBT BR3 (KCTC 12201BP). The owners of the dogs in the treatment group were instructed to administer 6 g (2 doses, 3 g each) per day to their dogs either alone or sprinkled on top of the dog food, according to the formula administration method.
The dog’s food was advised to maintain their usual intake as before the study began. Only the treatment group received probiotics in addition to their usual diet and physical activity routine. A trained researcher confirmed the amount of dog food intake by mobile application during the study. Also, inaccurate food intake was reconfirmed with the owners through a call.
Body weight and BCS and physical activity
The body weight and BCS of the dogs were measured at Week 0 and Week 12. Body weight was measured by a veterinarian using the same digital weighing scale (DL-150, CAS Co., Yangju-si, Republic of Korea). The BCS was measured by the same veterinarian based on a 9-point scale method per the guidelines provided by the World Small Animal Veterinary Association (www.WSAVA.org).
The amount of physical activity was automatically recorded collected by the pedometer (Pevo, DDCares Co., Seongnam-si, Republic of Korea). This pedometer is a device that automatically collects and calculates physical activity (kcal/day) by considering the dog’s breed, weight, age, etc.
Serum biochemistry
Blood samples were collected from subjects at Week 0 and Week 12. After collecting blood samples in tubes, they were left for at least 30 min and then centrifuged at 400 × g for 10 min at 4 °C. The serum was stored at -80 °C until analysis. The levels of triglyceride (TG) and total cholesterol (TC), low-density lipoprotein (LDL), high-density lipoprotein (HDL), aspartate aminotransferase (AST), alanine aminotransferase (ALT), and γ-glutamyl transferase (GGT) were analyzed using commercial kits following the manufacturer’s directions. Serum adiponectin, leptin, and insulin levels were measured using a commercial canine kit according to the manufacturer’s protocol. All samples were tested in duplicates.
Feces sampling
A veterinarian collected feces samples directly from the subjects’ rectums at Week 0 and Week 12. The feces samples were transported to the laboratory at 5 °C within 4 h. The feces samples were stored at -80 °C until analysis.
DNA extraction
Microbial DNA was isolated using a SPINeasy DNA Kit for Feces/Soil (MP Biomedicals, USA) in according to the manufacturer’s instructions. The quality of the extracted microbial DNA was assessed using both the QuickDrop spectrophotometer (Molecular Devices, USA) and the Qubit™ dsDNA BR Assay Kit (Thermo Fisher Scientific, USA), ensuring optimal integrity and concentration for subsequent applications.
16S rRNA gene sequencing
The bacterial 16 S rRNA gene’s V4-V5 region was amplified using specific primers: the forward primer (CCA GCM GCC GCG GTA ATW C) targeting the V4 region and a reverse primer (CC GTC AAT TYY) targeting the V5 region. The PCR-amplified DNA fragments were purified using Agencourt® AMPure XP beads (Beckman Coulter, USA) following the recommended protocols. The quality of the sequencing libraries was verified using the 2100 Bioanalyzer (Agilent, USA). Sequencing was conducted on the MiSeq platform (Illumina, USA) using the MiSeq Reagent Kit V2 (Illumina, USA).
Statistical analysis
All statistical analyses were performed using SAS 9.4 Software (SAS Institute Inc., Cary, NC, USA). Changes in the observed body weight, BCS, and serum biochemistry results were calculated by subtracting the final values from the baseline values, and their normality was tested. If a variable satisfied the normality assumption, the difference between the two groups was analyzed using an independent t-test. Otherwise, it was tested using the Wilcoxon rank sum test. Intragroup changes were analyzed using a paired t-test or Wilcoxon signed rank test according to normality. For categorical variables, the proportions between groups were calculated and compared using the Chi-square or Fisher’s exact test. In which the mean change in serum biochemistry represents an adjusted estimate after controlling for baseline difference in BCS, using a repeated measure linear mixed model measurements at baseline and 12 weeks. As for the analysis of the microbiome and DNA sequencing, sequencing outputs were processed into FASTQ files, for subsequent analyses. Data preprocessing was performed using the Quantitative Insights Into Microbial Ecology (QIIME 2, version 2023.5, http://qiime2.org) software package. Noise filtering was achieved using DADA2, and bacterial taxa were classified using the Greengenes2 database. Microbial diversity analysis, LEfSe analysis, relative abundance analysis, correlation analysis, network analysis and visualizations were conducted using R software (version 4.3.2). Datasets were compared using the Wilcoxon rank-sum test, Wilcoxon signed-rank test, Kruskal-Wallis test, and PERMANOVA. Correlation analysis was performed using Spearman’s rank correlation. For pathway analysis, STAMP software (version 2.1.3) was used. In network analysis at the genus level, node colors were assigned based on the phylum level, and node sizes reflected the relative abundance of each taxon. Edge color and thickness indicated the strength of correlations.
Results
Characteristics of subjects
During the 12 weeks study period, 11 subjects dropped out (Fig. 2). As a result, 41 subjects (78.8%) completed all treatments and completed physical examinations (e.g., weight and BCS 9-point scale), vital signs (e.g., heart rate, respiratory rate, and body temperature), owner-administered obesity-related clinical questionnaires (e.g., food intake and physical activity), serum biochemistry, and microbiota analysis (Fig. 2). No side effects, such as diarrhea, vomiting, etc., were observed during the study in the treatment group of dogs supplemented with a mixed probiotic formula containing Lactiplantibacillus plantarum CBT LP3 and Bifidobacterium breve CBT BR3.
There was no significant difference in the mean age between the treatment and the control groups (6.86 ± 0.66 years and 7.50 ± 0.56 years, respectively; Table 2).
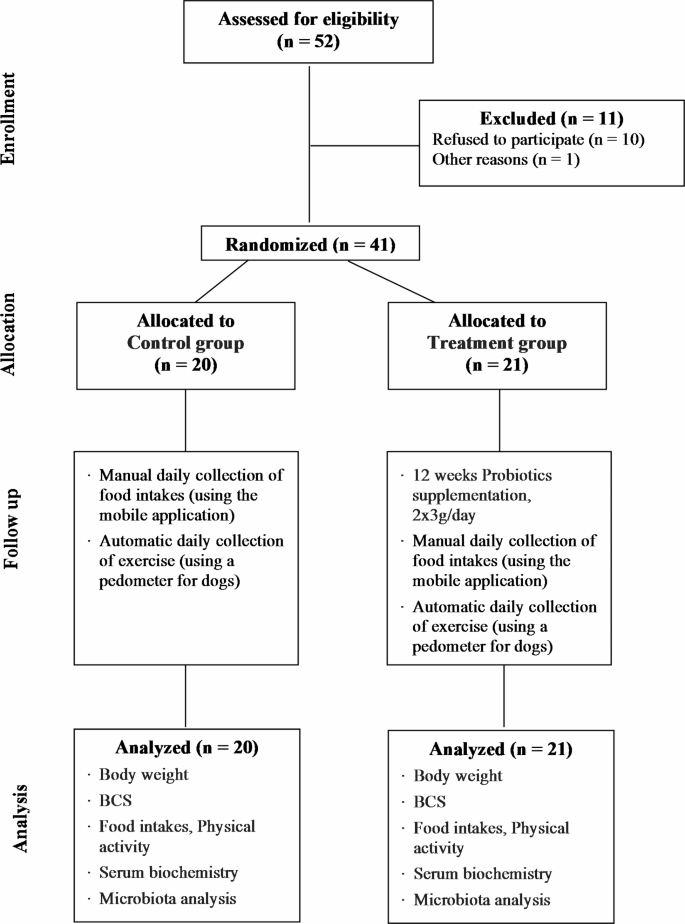
CONSORT flow chart of the study design.
Food intake and physical activity
The amount of physical activity was automatically recorded by the pedometer over 12 weeks, including the food intake of the dogs, including dog food and treats, excluding probiotic intake. This intake and physical activity regimen was maintained throughout the 12-week study period. During the study, the dogs were fed only commercial pet food with labels and did not eat homemade. The type of food was kibbles, and the treats were gum, chews, freeze-dried, jerky, and wet (canned). We calculated the energy intake based on the labels on the pet food. There were no significant difference between the two groups (Table 3).
Body weight and BCS
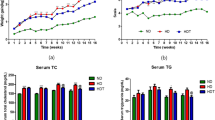
During the study periods (weeks 0 to 12), the 21 dogs of the treatment group lost a Mean ± SE of 0.39 ± 0.04 kg of body weight (Fig. 3 and Supplementary Table 1). Moreover, the body weight and BCS were significantly different between the two groups after 12 weeks. In the treatment group, 21 subjects (100%) lost weight, 18 subjects (85.7%) had decreased BCS, and 3 subjects (14.3%) showed no change in BCS. In the control group, 2 subjects (10%) lost weight, 2 subjects (10%) showed no change in weight, and 16 subjects (80%) gained weight. The BCS in 5 subjects (25%) increased, and 15 subjects (75%) had no change (Supplementary Table 2).

The changes in body weight and body condition score (BCS) within and between groups before and after 12 weeks of supplementation. (A) Body weight. (B) Body condition score (BCS). The results are presented as Mean ± SE. *p < 0.05, **p < 0.01, ***p < 0.001, and ****p < 0.0001.
Serum biochemistry
Serum TG and TC levels decreased more significantly in the treatment group than in the control group, and differed significantly between the two groups. Serum LDL levels in the treatment group were lower than those in the control group. However, the difference was not significant. Serum HDL levels increased in both control and treatment groups. However, the difference was not significant. Serum AST, ALT, and GGT levels in the treatment group were lower than those in the control group. However, the differences were not significant. Serum adiponectin levels in the treatment group were significantly higher than those in the control group. Serum leptin levels in the treatment group were significantly lower than those in the control group, with a significant difference between the two groups. Serum insulin levels were significantly lower after probiotic administration (Fig. 4 and Supplementary Table 3).


The changes in TG, TC, LDL, HDL, AST, ALT, GGT, adiponectin, leptin, and insulin levels within and between groups before and after 12 weeks of supplementation. (A) Serum TG. (B) Serum TC. (C) Serum LDL. (D) Serum HDL. (E) Serum AST. (F) Serum ALT. (G) Serum GGT. (H) Serum adiponectin. (I) Serum leptin. (J) Serum insulin. The results are presented as Mean ± SEM. *p < 0.05, **p < 0.01, ***p < 0.001, and ****p < 0.0001.
Changes in microbial diversity
We conducted amplicon sequencing of the 16 S rRNA gene and analyzed the microbial diversity during two visits (Week 0 and Week 12), before and after probiotics administration (Fig. 5). Alpha-diversity metrics, including observed ASVs, Shannon diversity, and Pielou’s evenness, were calculated and further categorized them into Visit 1 (Week 0) and Visit 2 (Week 12) for comparison. The ASVs decreased significantly after probiotics administration.

Box plot of the alpha diversity of the treatment and the control groups. (A) The number of observed amplicon sequence variants (ASVs). (B) The Shannon diversity index. (C) The evenness index.
We also analyzed beta-diversity to compare the changes in microbial communities between the two groups (Supplementary Fig. 1). They were not significantly different, and these differences were attributed to the properties of the groups, rather than the effects of probiotic.
Taxonomic shifts after probiotics administration
We assessed the changes in taxa at both the phylum and genus levels during visits, before and after probiotic intake (Supplementary Fig. 2). When a taxon accounted for less than 1% of the total population, it was merged and labeled as “others”. Some microbial organisms at the genus level changed significantly between the two visits. In the control group, Lacticaseibacillus increased significantly, whereas Lactobacillus, Alistipes_A_871400, Gemella, and Propionobacteriaceae_Unassigned decreased significantly (Fig. 6). In the treatment group, Lactiplantibacillus increased significantly, whereas Erysipelatoclostridium, Faecalibacterium, Staphylococcus, Corynebacterium, Gemella, Muribaculum, Muribaculaceae_Unassigned, Faecalibaculum, Paramuribaculum, Akkermansia, and UBA3263 decreased significantly. Gemella decreased in both groups. Lactiplantibacillus, the genus that includes the ingested probiotics CBT-LP3, significantly increased after probiotics administration in most samples (Fig. 7).

The results of Linear discriminant analysis (LDA) effect size (LEfSe) analysis identifying phylum.

The relative abundance of Lactiplantibacillus between the treatment and the control groups.
Metabolic pathway analysis
The results of the PICRUSt2 analysis revealed alterations in several key metabolic pathways (Supplementary Fig. 3). In the control group, “mixed acid fermentation” increased, while “arginine, ornithine and proline interconversion”, “superpathway of beta-D-glucuronide and D-glucuronate degradation”, “D-fructuronate degradation”, and “peptidoglycan biosynthesis V (beta-lactam resistance)” decreased. In the treatment group, “polyisoprenoid biosynthesis (E. coli)”, “6-hydroxymethyl-dihydropterin diphosphate biosynthesis I”, “6-hydroxymethyl-dihydropterin diphosphate biosynthesis III (Chlamydia)”, “flavin biosynthesis I (bacteria and plants)”, and “glycolysis II (from fructose 6-phosphate)” increased, while “formaldehyde assimilation II (RuMP Cycle)” and “succinate fermentation to butanoate” significantly decreased.
Correlation analysis with health markers
We analyzed the correlation between Lactiplantibacillus, which significantly increased with probiotics intake, and various metadata (Fig. 8). In the control group, weight, AST, and leptin were positively correlated with Lactiplantibacillus, whereas BCS, TC, LDL, HDL, TG, ALT, Gamma-GT, adiponectin, and insulin were negatively correlated with it, but none were statistically significant. In the treatment group, Lactiplantibacillus correlated positively with weight, TC, HDL, adiponectin, and leptin and negatively with BCS, LDL, TG, AST, ALT, Gamma-GT, and insulin. Among these, the correlations of Gamma-GT and In with Lactiplantibacillus were significant.

The results of metadata correlation analysis of Lactiplantibacillus. Ad: adiponectin. In: insulin. Le: leptin.
A microbial network analysis was conducted to observe changes in the gut microbiota before and after probiotic administration in the treatment group (Fig. 9). Before administration (Treatment week 0), Collinsella and Faecalimonas were identified as keystones, with the administered probiotic, Lactiplantibacillus, showing a direct positive correlation with these keystones. After administration (Treatment week 12), Peptacetobacter and Fusobacterium_A emerged as keystones, while Lactiplantibacillus demonstrated an indirect positive correlation with these keystones through Fusobacterium_B.

The results of a network analysis on the gut microbiota.
Discussion
This study was conducted to understand the effects of supplementation with a mixed probiotic formula containing Lactiplantibacillus plantarum CBT LP3 and Bifidobacterium breve CBT BR3 on the body weight, BCS, serum biochemistry, and gut microbiota of overweight or obese dogs. Numerous previous studies reported the anti-obesity effects of Lactiplantibacillus plantarum or Bifidobacterium breve on mice and humans. However, to date, no study has examined the anti-obesity effects of a mixed probiotic formula containing Lactiplantibacillus plantarum and Bifidobacterium breve in dogs.
It is challenging to identify the optimal body weight for dogs, given the considerable variation in body shape, muscle mass, and fat mass among breeds, genders, and neuter statuses. However, body weight is still one of the most objective and easily measurable indicators of obesity. It is also possible to enhance the reliability of body weight measurements by measuring the BCS, although the BCS is a subjective and semiquantitative method. In this study, body weight and BCS decreased significantly in the treatment group, which consumed the mixed probiotic formula containing Lactiplantibacillus plantarum CBT LP3 and Bifidobacterium breve CBT BR3, compared with the control group, which did not receive the formula (Table 3; Fig. 3). These results are consistent with those of previous studies, which showed that Lactiplantibacillus plantarum strains decreased the body weight of mice41,45,46, and humans47,48. Sung et al.39 and Chaiyasut et al.49 also revealed that Bifidobacterium breve strains reduce the body weight of humans, which is consistent with the results of this study. To our knowledge, the effectiveness of these strains in reducing BCS in dogs has not been reported to date.
The serum lipid profiles of obese dogs were similar to those of obese humans, with higher serum TG, TC, and LDL concentrations and lower serum HDL concentrations50. There are four types of adipose tissue: white adipose tissue (WAT), brown adipose tissue (BAT), beige adipose tissue (BeAT), and pink adipose tissue (PAT). Excess energy intake is stored in the WAT in the form of TG, and the WAT is expanded. This process is an important mechanism in body fat accumulation and obesity51. The results of this study showed that the TG level of the treatment group decreased significantly more than that of the control group (Fig. 4), which is consistent with the effects of Lactiplantibacillus plantarum strains on mice26, and the effects of fed Bifidobacterium breve strains on humans39,49,52. The treatment group showed a significant reduction in serum TC and a greater decrease in LDL than did the control group, which was consistent with decreased TC53, and LDL levels53,54 in mice fed Lactiplantibacillus plantarum strains alone and decreased TC39,49, and LDL levels39,49 in humans administered Bifidobacterium breve strains alone.
Ertek55 reported that reduced serum HDL levels increase the incidence of cardiovascular disease. Obesity lowers the serum HDL concentration, leading to dysfunction. A few studies have evaluated serum HDL status in obese dogs and yielded conflicting results: obese dogs with insulin resistance showed higher serum HDL concentrations than healthy dogs56. Patients with obesity having insulin resistance show increased activation of cholesteryl ester transfer protein (CETP), which transforms very low-density lipoprotein (VLDL) into HDL and LDL56,57. Furthermore, HDL with high triglycerides is more prone to apoA-1 cleavage and increases urinary excretion, resulting in lower serum HDL concentrations56,57. On the other hand, dogs generally do not have CETP activity56. Consequently, unlike humans, obese dogs have higher serum HDL concentrations than healthy dogs56. The results of this study showed that serum HDL concentration increased more in the treatment group than in the control group, which could be due to the effects of the mixed probiotic formula containing Lactiplantibacillus plantarum CBT LP3 and Bifidobacterium breve CBT BR3. However, it could not be confirmed because this study did not examine the insulin resistance of the subjects. However, further studies are needed to confirm this speculation. These results are consistent with the results of a mouse study with Lactiplantibacillus plantarum strains alone54, and human studies with Bifidobacterium breve strains alone49,52. It was observed that serum HDL concentration also increased in the control group, which could be because some subjects had insulin resistance or because there was no difference in the physical activity measured using a pedometer between the two groups during the treatment period. Further studies with additional cases are needed to confirm the exact association.
The gut microbiota is known to axis with various organs such as the liver, brain, kidneys, bone, and cardiovascular system58. Especially, it has been reported that it is associated with many liver diseases, such as chronic hepatitis B, chronic hepatitis C, alcoholic liver disease, and non-alcoholic fatty liver disease, through the gut-liver axis depending on the composition of the gut microbiota58. Therefore, a better gut microbiota environment can improve many liver diseases58. The results of this study showed a greater decrease in serum AST, ALT, and GGT concentrations in the treatment group compared to the control group because the gut microbiota environment of the treatment group was improved by consuming a mixed probiotic formula containing Lactiplantibacillus plantarum CBT LP3 and Bifidobacterium breve CBT BR3 (Figs. 7 and 8). These results agree with the decreased AST59, ALT59, and GGT60 levels in mice fed Lactiplantibacillus plantarum strains alone and the reduced AST49,61, ALT49,61, and GGT61 levels in humans receiving Bifidobacterium breve strains alone. Notably, the genus Lactiplantibacillus, which includes the ingested probiotic strain LP3, significantly increased afterintake (Fig. 7). This increase in Lactiplantibacillus correlated with several positive health outcomes (Fig. 8), suggesting its role in mediating the observed health benefits. Specifically, the negative correlations with GGT and insulin levels point to potential improvements in liver function and insulin sensitivity, respectively62. These findings highlight the potential of probiotics in enhancing metabolic health by, affecting both gut health and systemic function63.
In addition, supplementation with a mixed probiotic formula containing Lactiplantibacillus plantarum CBT LP3 and Bifidobacterium breve CBT BR3 for 12 weeks resulted in the treatment group showed no apparent hepatotoxicity.
WAT accumulation in the body is responsible for the secretion of adipokines, adiponectin, and leptin51. Adiponectin is strongly inversely correlated insulin resistance and inflammatory conditions within the body64. It is also known to induce lipoprotein lipase (LPL) expression in adipocytes and increase their lipolytic capacity64. The primary function of leptin is to suppress appetite and increase energy expenditure by binding to the obesity receptor (Ob-R) in the satiety control center located in the hypothalamus65. Leptin is positively correlated with BCS regardless of the dog’s age, sex, and breed66. Adiponectin is negatively correlated with body fat mass and is therefore higher in leaner dogs66. In addition, excess body fat in dogs increases insulin resistance and prevalence of diabetes6. In this study, the treatment group showed a significant increase in serum adiponectin concentration, a significant decrease in leptin concentration, and a greater decrease in insulin concentration, which agreed with increased adiponectin67, decreased leptin67, and decreased insulin67 in mice fed Lactiplantibacillus plantarum strains alone and the increased adiponectin39, decreased leptin39, and decreased insulin68 in humans administered Bifidobacterium breve strains alone.
The microbiota analysis results of this study revealed that after 12 weeks, Lactiplantibacillus significantly increased in the treatment group while Erysipelatoclostridium, Staphylococcus, and Gemella significantly decreased (Fig. 7). Erysipelatoclostridium strains are known to increase the risk of obesity and fatty liver69,70, while Staphylococcus strains increase obesity and diabetes risk71. Moreover, Gemella (Firmicutes) are associated with increased body fat and decreased muscle mass72 (Figs. 7 and 8).
The network analysis revealed that the keystone of the treatment group at Visit 1 (Week 0) was Collinsella. Collinsella aerofaciens is a rod-shaped, nonmotile obligate anaerobe and actinobacterium that is abundant in the gastrointestinal tract of humans73. It could be considered a bacterial biomarker because of its high prevalence in patients who are overweight and obese74. The keystone at Visit 2 (Week 12) was Peptacetobacter. Peptacetobacter hiranonis plays a crucial role in the bile acid metabolic pathway in dogs, converting primary bile acids into secondary bile acids75. The metabolism of bile acids can improve liver function by reducing GGT, enhancing insulin sensitivity, and playing a vital role in regulating glucose homeostasis76. Lactiplantibacillus showed a negative correlation with GGT and insulin and an indirect positive correlation with Peptacetobacter, which may be related to the regulation of these indices. In this study, Lactiplantibacillus plantarum, the probiotic ingested by the treatment group, had numerous two-component systems that were, potentially involved in the management of sugar metabolism, and a high carbohydrate utilization capacity compared to other lactic acid bacteria77. Lactiplantibacillus plantarum has been shown to effectively suppress obesity in both animal and clinical studies78.
Using PICRUSt2 79, we identified significant changes in metabolic pathways (Supplementary Fig. 2). In the treatment group, pathways such as “polyisoprenoid biosynthesis”, “flavin biosynthesis”, and “glycolysis II” increased, while “formaldehyde assimilation II” and “succinate fermentation to butanoate” decreased. These changes underscore the potential of probiotics to influence host metabolism80,81. The increase in glycolysis pathways aligns with enhanced energy utilization, which could explain the observed weight management in these dogs82.
While our results are promising, they should be interpreted with caution due to the limited scope of the study and the inherent variability in host responses to probiotics. This variability may stem from the fact that our study included a small sample size consisting of dogs of various breeds, ages, and sexes.
The interpretation of microbiome changes is inherently complex, and although PICRUSt2 provides valuable insights, it remains a predictive tool rather than a definitive measure of functional capabilities. Additionally, the taxonomic resolution achieved in this study was at the genus level, which does not conclusively confirm the presence and activity of the specific ingested probiotic strain. Future research should include a larger cohort and longitudinal monitoring to validate these effects and to understand the long-term implications of probiotic administration in dogs. Furthermore, employing strain-specific analyses and functional validation will be essential to confirm and build upon these findings.
Conclusion
This study demonstrated that targeted probiotic supplementation can significantly alter the gut microbiome and enhance metabolic health in dogs, suggesting that probiotics could be an effective strategy for managing obesity and improving metabolic health in canine populations.
Therefore, further research is necessary to fully elucidate the mechanisms involved and confirm these results in larger and, more diverse cohorts. Additional studies are also necessary to explore the association between insulin resistance and serum HDL concentration in dogs as suggested in this study.
Despite these limitations, the results of this study suggest that a mixed probiotic formula, containing Lactiplantibacillus plantarum CBT LP3 and Bifidobacterium breve CBT BR3 may, have anti-obesity effects in overweight and obese dogs. Consequently, this formula may be an effective canine food supplement for the treatment of canine obesity.
Data availability
The metagenome datasets generated during and/or analyzed during the current study are available in the National Center for Biotechnology Information (NCBI) repository, under the accession number ‘PRJNA1123865’ (https://www.ncbi.nlm.nih.gov/bioproject/PRJNA1123865). All other datasets generated during the current study are available from the corresponding authors upon reasonable request.
References
-
Zoran, D. L. Obesity in dogs and cats: A metabolic and endocrine disorder. Vet. Clini.: Small Anim. Pract. 40, 221–239 (2010).
-
Weeth, L. P. Other risks/possible benefits of obesity. Vet. Clin.: Small Anim. Pract. 46, 843–853 (2016).
-
Park, H. J., Lee, S. E., Oh, J. H., Seo, K. W. & Song, K. H. Leptin, Adiponectin and serotonin levels in lean and obese dogs. BMC Vet. Res. 10, 1–8 (2014).
-
Gadde, K. M., Martin, C. K., Berthoud, H. R. & Heymsfield, S. B. Obesity: Pathophysiology and management. J. Am. Coll. Cardiol. 71, 69–84 (2018).
-
Lee, H. J. et al. Effects of synbiotic preparation containing lactobacillus gasseri BNR17 on body fat in obese dogs: A pilot study.Animals 12, 642 (2022).
-
Clark, M. & Hoenig, M. Metabolic effects of obesity and its interaction with endocrine diseases. Vet. Clin. North. Am. Small Anim. Pract. 46, 797–815. https://doi.org/10.1016/j.cvsm.2016.04.004 (2016).
-
Haddad, K. K. How successful are veterinary weight management plans for canine patients experiencing poor welfare due to being overweight and obese? Animal (Basel) 14 https://doi.org/10.3390/ani14050740 (2024).
-
Burkholder, W. J. & Bauer, J. E. Foods and techniques for managing obesity in companion animals. J. Am. Vet. Med. Assoc. 212, 658–662 (1998).
-
German, A. J. & 1940S-1946S. The growing problem of obesity in dogs and cats1, 2, 3. J. Nutr. 136 https://doi.org/10.1093/jn/136.7.1940S (2006). https://doi.org:.
-
McGreevy, P. D. et al. Prevalence of obesity in dogs examined by Australian veterinary practices and the risk factors involved. Vet. Rec. 156, 695–702. https://doi.org/10.1136/vr.156.22.695 (2005).
-
Laflamme, D. Developmental and validation of a body condition score system for dogs. (1997).
-
Laflamme, D. Development and validation of a body condition score system for cats: A clinical tool. (1997).
-
German, A. J. et al. A Simple, Reliable tool for owners to assess the body condition of their dog or cat1, 2, 3. J. Nutr. 136, 2031S–2033S (2006). https://doi.org/10.1093/jn/136.7.2031S
-
Bjornvad, C. R. et al. Evaluation of a nine-point body condition scoring system in physically inactive pet cats. Am. J. Vet. Res. 72, 433–437. https://doi.org/10.2460/ajvr.72.4.433 (2011).
-
Park, M. et al. Effect of black ginseng and silkworm supplementation on obesity, the transcriptome, and the gut microbiome of diet-induced overweight dogs. Sci. Rep. 11, 16334. https://doi.org/10.1038/s41598-021-95789-8 (2021).
-
Montoya, M. et al. Life expectancy tables for dogs and cats derived from clinical data. Front. Vet. Sci. 10 https://doi.org/10.3389/fvets.2023.1082102 (2023).
-
German, A., Holden, S., Morris, P. & Biourge, V. Long-term follow-up after weight management in obese dogs: The role of diet in preventing regain. Vet. J. 192, 65–70 (2012).
-
Deagle, G., Holden, S., Biourge, V., Queau, Y. & German, A. The kinetics of weight loss in obese client-owned dogs. J. Vet. Intern. Med. 29, 443–444 (2015).
-
German, A. J. Obesity prevention and Weight maintenance after loss. Vet. Clin. North. Am. Small Anim. Pract. 46, 913–929. https://doi.org/10.1016/j.cvsm.2016.04.011 (2016).
-
Grześkowiak, Ł., Endo, A., Beasley, S. & Salminen, S. Microbiota and probiotics in canine and feline welfare. Anaerobe 34, 14–23. https://doi.org/10.1016/j.anaerobe.2015.04.002 (2015).
-
Lin, X. Q. et al. Akkermansia muciniphila suppresses high-Fat Diet-Induced obesity and related metabolic disorders in Beagles. Molecules. 27 https://doi.org/10.3390/molecules27186074 (2022).
-
Sun, H. et al. Different diet energy levels alter body condition, glucolipid metabolism, fecal microbiota and metabolites in adult beagle dogs. Metabolites 13 https://doi.org/10.3390/metabo13040554 (2023).
-
Park, H. J. et al. Association of obesity with serum leptin, adiponectin, and serotonin and gut microflora in beagle dogs. J. Vet. Intern. Med. 29, 43–50. https://doi.org/10.1111/jvim.12455 (2015).
-
Moinard, A. et al. Effects of high-fat diet at two energetic levels on fecal microbiota, colonic barrier, and metabolic parameters in dogs. Front. Vet. Sci. 7, 566282. https://doi.org/10.3389/fvets.2020.566282 (2020).
-
Turroni, F. et al. Molecular dialogue between the human gut microbiota and the host: A Lactobacillus and Bifidobacterium perspective. Cell. Mol. Life Sci. 71, 183–203. https://doi.org/10.1007/s00018-013-1318-0 (2014).
-
Jang, K. O. et al. Anti-obesity potential of heat-killed lactiplantibacillus plantarum K8 in 3T3-L1 cells and high-fat diet mice. Heliyon 9, e12926. https://doi.org/10.1016/j.heliyon.2023.e12926 (2023).
-
Pothuraju, R. et al. Mucins, gut microbiota, and postbiotics role in colorectal cancer. Gut Microbes 13, 1974795. https://doi.org/10.1080/19490976.2021.1974795 (2021).
-
John, G. K. & Mullin, G. E. The gut microbiome and obesity. Curr. Oncol. Rep. 18, 45. https://doi.org/10.1007/s11912-016-0528-7 (2016).
-
Fischer, N. & Relman, D. A. Clostridium difficile, aging, and the gut: Can microbiome rejuvenation keep us young and healthy? J. Infect. Dis. 217, 174–176. https://doi.org/10.1093/infdis/jix417 (2018).
-
Kobyliak, N., Virchenko, O. & Falalyeyeva, T. Pathophysiological role of host microbiota in the development of obesity. Nutr. J. 15, 43. https://doi.org/10.1186/s12937-016-0166-9 (2016).
-
Wang, M. et al. Intervention of five strains of Lactobacillus on obesity in mice induced by high-fat diet. J. Funct. Foods. 72, 104078 (2020).
-
Cuevas-Sierra, A. et al. Gut microbiota, and obesity: links with host genetics and epigenetics and potential applications. Adv. Nutr. 10, S17–s30. https://doi.org/10.1093/advances/nmy078 (2019).
-
Yang, M. et al. Pharmaceutical efficacy of novel human-origin Faecalibacterium prausnitzii strains on high-fat-diet-induced obesity and associated metabolic disorders in mice. Front. Endocrinol. (Lausanne) 14, 1220044. https://doi.org/10.3389/fendo.2023.1220044 (2023).
-
Choi, S., Baek, M. G., Chung, M. J., Lim, S. & Yi, H. Distribution of bacteriocin genes in the lineages of lactiplantibacillus plantarum. Sci. Rep. 11, 20063. https://doi.org/10.1038/s41598-021-99683-1 (2021).
-
Cukrowska, B., Bierła, J. B., Zakrzewska, M., Klukowski, M. & Maciorkowska, E. The relationship between the infant gut microbiota and allergy. The role of Bifidobacterium breve and prebiotic oligosaccharides in the activation of anti-allergic mechanisms in early life. Nutrients 12 https://doi.org/10.3390/nu12040946 (2020).
-
Ma, T. et al. Effect of the probiotic strain, lactiplantibacillus plantarum P9, on chronic constipation: a randomized, double-blind, placebo-controlled study. Pharmacol. Res. 191, 106755. https://doi.org/10.1016/j.phrs.2023.106755 (2023).
-
Ahrén, I. L., Hillman, M., Nordström, E. A., Larsson, N. & Niskanen, T. M. Fewer community-acquired colds with daily consumption of lactiplantibacillus plantarum HEAL9 and lacticaseibacillus paracasei 8700:2. A randomized, placebo-controlled clinical trial. J. Nutr. 151, 214–222. https://doi.org/10.1093/jn/nxaa353 (2021).
-
Shin, S. M. et al. A 12-Week, Single-Centre, Randomised, Double-Blind, Placebo-Controlled, parallel-design clinical trial for the evaluation of the efficacy and safety of lactiplantibacillus plantarum SKO-001 in reducing body Fat. Nutrients 16 https://doi.org/10.3390/nu16081137 (2024).
-
Sung, H. K., Youn, S. J., Choi, Y., Eun, S. W. & Shin, S. M. Body fat reduction effect of bifidobacterium breve B-3: A randomized, double-blind, placebo comparative clinical trial. Nutrients 15 (2022). https://doi.org/10.3390/nu15010028
-
Ouwehand, A. C. et al. Bifidobacterium Microbiota and parameters of immune function in elderly subjects. FEMS Immunol. Med. Microbiol. 53, 18–25. https://doi.org/10.1111/j.1574-695X.2008.00392.x (2008).
-
Kim, S., Huang, E., Ji, Y., Holzapfel, W. H. & Lim, S. D. Probiotic property and anti-obesity effect of lactiplantibacillus plantarum KC3. Food Sci. Anim. Resour. 42, 996–1008. https://doi.org/10.5851/kosfa.2022.e43 (2022).
-
Jacouton, E., Mondot, S., Langella, P. & Bermúdez-Humarán, L. G. Impact of oral administration of lactiplantibacillus plantarum strain CNCM I-4459 on obesity induced by high-fat diet in mice. Bioengineering (Basel) 10. https://doi.org/10.3390/bioengineering10101151 (2023).
-
Kondo, S. et al. Antiobesity effects of Bifidobacterium breve strain B-3 supplementation in a mouse model with high-fat diet-induced obesity. Biosci. Biotechnol. Biochem. 74, 1656–1661. https://doi.org/10.1271/bbb.100267 (2010).
-
Yam, P. S. et al. Children, parents, and pets exercising together (CPET) randomised controlled trial: Study rationale, design, and methods. BMC Public. Health 12, 208. https://doi.org/10.1186/1471-2458-12-208 (2012).
-
Di Micioni, M. V. et al. Supplementation with lactiplantibacillus plantarum IMC 510 modifies microbiota composition and prevents body weight gain induced by cafeteria diet in rats. Int. J. Mol. Sci. 22 https://doi.org/10.3390/ijms222011171 (2021).
-
Lim, J. J., Jung, A. H., Suh, J., Choi, H., Kim, H. & H. S. & Lactiplantibacillus plantarum K8-based paraprobiotics prevents obesity and obesity-induced inflammatory responses in high fat diet-fed mice. Food Res. Int. 155, 111066. https://doi.org/10.1016/j.foodres.2022.111066 (2022).
-
Pagliai, G. et al. Effects of the probiotic lactiplantibacillus plantarum IMC 510® on body composition, biochemical parameters, gut microbiota composition and function, and clinical symptoms of overweight/obese subjects. Front. Nutr. 10, 1142527. https://doi.org/10.3389/fnut.2023.1142527 (2023).
-
Coman, M. M. et al. Effects of probiotic lactiplantibacillus plantarum IMC 510 supplementation on metabolic factors in otherwise healthy overweight and obese individuals. J. Appl. Microbiol. 133, 1956–1968. https://doi.org/10.1111/jam.15703 (2022).
-
Chaiyasut, C. et al. Influence of bifidobacterium breve on the glycaemic control, lipid profile and Microbiome of type 2 diabetic subjects: A preliminary Randomized Clinical Trial. Pharmaceuticals (Basel) 16. https://doi.org/10.3390/ph16050695 (2023).
-
Marchi, P. H. et al. Obesity, inflammation, and cancer in dogs: Review and perspectives. Front. Vet. Sci. 9, 1004122. https://doi.org/10.3389/fvets.2022.1004122 (2022).
-
Fortunato, I. M. et al. Metabolic Insights into caffeine’s anti-adipogenic effects: An exploration through intestinal microbiota modulation in obesity. Int. J. Mol. Sci. 25 https://doi.org/10.3390/ijms25031803 (2024).
-
Minami, J. et al. Effects of Bifidobacterium breve B-3 on body fat reductions in pre-obese adults: A randomized, double-blind, placebo-controlled trial. Biosci. Microbiota Food Health 37, 67–75. https://doi.org/10.12938/bmfh.18-001 (2018).
-
Tian, L. et al. Probiotic characteristics of lactiplantibacillus plantarum N-1 and its cholesterol-lowering effect in hypercholesterolemic rats. Probiotics Antimicrob. Proteins 14, 337–348. https://doi.org/10.1007/s12602-021-09886-1 (2022).
-
Dhameliya, H. A. et al. Lactiplantibacillus plantarum PGB02 improved serum cholesterol Profile by tweaking genes involved in cholesterol homeostasis in male Swiss albino mice. Appl. Biochem. Biotechnol. 195, 3180–3193. https://doi.org/10.1007/s12010-022-04307-7 (2023).
-
Ertek, S. High-density lipoprotein (HDL) dysfunction and the future of HDL. Curr. Vasc Pharmacol. 16, 490–498. https://doi.org/10.2174/1570161115666171116164612 (2018).
-
Bailhache, E. et al. Lipoproteins abnormalities in obese insulin-resistant dogs. Metabolism 52, 559–564. https://doi.org/10.1053/meta.2003.50110 (2003).
-
King, T. W., Cochran, B. J. & Rye, K. A. ApoA-I and diabetes. Arterioscler. Thromb. Vasc Biol. 43, 1362–1368. https://doi.org/10.1161/atvbaha.123.318267 (2023).
-
Milosevic, I. et al. Gut-liver Axis, Gut Microbiota, and its modulation in the management of Liver diseases: A review of the literature. Int. J. Mol. Sci. 20 https://doi.org/10.3390/ijms20020395 (2019).
-
Lee, N. K. et al. Hepatoprotective Effect of lactiplantibacillus plantarum DSR330 in mice with high fat diet-Induced nonalcoholic fatty liver disease. J. Microbiol. Biotechnol. 34, 399–406. https://doi.org/10.4014/jmb.2310.10026 (2024).
-
Pružinská, K. et al. Enhanced anti-inflammatory effect of the combination of lactiplantibacillus plantarum LS/07 with methotrexate compared to their monotherapies studied in experimental arthritis. Molecules 28 https://doi.org/10.3390/molecules28010297 (2022).
-
Kobayashi, Y., Kuhara, T., Oki, M. & Xiao, J. Z. Effects of bifidobacterium breve A1 on the cognitive function of older adults with memory complaints: A randomised, double-blind, placebo-controlled trial. Benef. Microbes 10, 511–520. https://doi.org/10.3920/BM2018.0170 (2019).
-
Sáez-Lara, M. J., Robles-Sanchez, C., Ruiz-Ojeda, F. J., Plaza-Diaz, J. & Gil, A. Effects of probiotics and synbiotics on obesity, insulin resistance syndrome, type 2 diabetes and non-alcoholic fatty liver disease: A review of human clinical trials. Int. J. Mol. Sci. 17, 928 (2016).
-
Sun, Y. et al. Assessments of probiotic potentials of lactiplantibacillus plantarum strains isolated from Chinese traditional fermented food: Phenotypic and genomic analysis. Front. Microbiol. 13 https://doi.org/10.3389/fmicb.2022.895132 (2022).
-
Yanai, H. & Yoshida, H. Beneficial effects of Adiponectin on glucose and lipid metabolism and atherosclerotic progression: Mechanisms and perspectives. Int. J. Mol. Sci. 20 https://doi.org/10.3390/ijms20051190 (2019).
-
Huang, L. & Li, C. Leptin: A multifunctional hormone. Cell. Res. 10, 81–92. https://doi.org/10.1038/sj.cr.7290038 (2000).
-
Ricci, R. & Bevilacqua, F. The potential role of leptin and adiponectin in obesity: A comparative review. Vet. J. 191, 292–298. https://doi.org/10.1016/j.tvjl.2011.04.009 (2012).
-
Choi, M. J. et al. Anti-obesity effects of lactiplantibacillus plantarum SKO-001 in high-fat diet-induced obese mice. Eur. J. Nutr. 62, 1611–1622. https://doi.org/10.1007/s00394-023-03096-x (2023).
-
Solito, A. et al. Supplementation with Bifidobacterium breve BR03 and B632 strains improved insulin sensitivity in children and adolescents with obesity in a cross-over, randomized double-blind placebo-controlled trial. Clin. Nutr. 40, 4585–4594. https://doi.org/10.1016/j.clnu.2021.06.002 (2021).
-
Chen, G. et al. Fluoride induced leaky gut and bloom of Erysipelatoclostridium Ramosum mediate the exacerbation of obesity in high-fat-diet fed mice. J. Adv. Res. 50, 35–54. https://doi.org/10.1016/j.jare.2022.10.010 (2023).
-
Milton-Laskibar, I. et al. Gut Microbiota induced by pterostilbene and resveratrol in high-fat-high-fructose fed rats: Putative role in steatohepatitis onset. Nutrients 13 https://doi.org/10.3390/nu13051738 (2021).
-
Olsen, K. et al. Obesity and Staphylococcus aureus nasal colonization among women and men in a general population. PLoS One 8, e63716. https://doi.org/10.1371/journal.pone.0063716 (2013).
-
Palmas, V. et al. Gut microbiota markers associated with obesity and overweight in Italian adults. Sci. Rep. 11, 5532. https://doi.org/10.1038/s41598-021-84928-w (2021).
-
Bag, S., Ghosh, T. S. & Das, B. Complete genome sequence of collinsella aerofaciens isolated from the gut of a healthy Indian subject. Genome Announc 5 https://doi.org/10.1128/genomeA.01361-17 (2017).
-
Companys, J. et al. Gut microbiota profile and its association with clinical variables and dietary intake in overweight/obese and lean subjects: A cross-sectional study. Nutrients 13 https://doi.org/10.3390/nu13062032 (2021).
-
Correa Lopes, B. et al. Correlation between peptacetobacter Hiranonis, the baiCD gene, and secondary bile acids in Dogs. Animals 14, 216 (2024).
-
Ahmad, T. R. & Haeusler, R. A. Bile acids in glucose metabolism and insulin signalling—mechanisms and research needs. Nat. Rev. Endocrinol. 15, 701–712. https://doi.org/10.1038/s41574-019-0266-7 (2019).
-
Cui, Y., Wang, M., Zheng, Y., Miao, K. & Qu, X. The Carbohydrate metabolism of lactiplantibacillus plantarum. Int. J. Mol. Sci. 22, 13452 (2021).
-
Pagliai, G. et al. Effects of the probiotic lactiplantibacillus plantarum IMC 510® on body composition, biochemical parameters, gut microbiota composition and function, and clinical symptoms of overweight/obese subjects. Front. Nutr. 10 https://doi.org/10.3389/fnut.2023.1142527 (2023).
-
Douglas, G. M. et al. PICRUSt2: An improved and customizable approach for metagenome inference. bioRxiv 672295. https://doi.org/10.1101/672295 (2020).
-
Parvez, S., Malik, K. A., Ah Kang, S. & Kim, H. Y. Probiotics and their fermented food products are beneficial for health. J. Appl. Microbiol. 100, 1171–1185. https://doi.org/10.1111/j.1365-2672.2006.02963.x (2006).
-
Apper, E. et al. Relationships between gut microbiota, metabolome, body weight, and glucose homeostasis of obese dogs fed with diets differing in prebiotic and protein content. Microorganisms 8, 513 (2020).
-
Herrera Uribe, J. et al. Physical training and weight loss in dogs lead to transcriptional changes in genes involved in the glucose-transport pathway in muscle and adipose tissues. Vet. J. 208, 22–27. https://doi.org/10.1016/j.tvjl.2015.11.002 (2016).
Acknowledgements
This research was supported by Cell Biotech Co Ltd. The funders had no role in study design, data collection and interpretation, manuscript interpretation, or the decision to publish the manuscript.
Funding
This work was supported by the Korea Institute of Planning and Evaluation for Technology in Food, Agriculture, Forestry, and Fisheries funded by the Ministry of Agriculture, Food, and Rural Affairs (321036-05-3-HD060), and the Technology Development Program (00218423) funded by the Ministry of SMEs and Startups (MSS, Korea).
Author information
Authors and Affiliations
Contributions
All the authors participated in the analyses of the biochemical data, interpretation of the data, and review of the paper. HJL contributed to the study’s design and review-editing. JC conducted prepared the writing and original draft and data arrangement. DS conducted analysis for microbiome data. SA conducted the investigation. EC contributed to sample preparation. SL and HJL conceptualized and supervised the study. All authors have read and agreed to the published version of the manuscript.
Corresponding authors
Ethics declarations
Competing interests
The authors declare no competing interests.
Ethics approval
Prior to the commencement of the study, all dog owners’ written informed consent for inclusion in the study was by themselves. The Gachon University Institutional Animal Care and Use Committee (IACUC approved No. GU1-2023-IA0037-00), and the Gachon University Institutional Review Board (IRB approved No. 1044396-202306-HR-089-01).
Additional information
Publisher’s note
Springer Nature remains neutral with regard to jurisdictional claims in published maps and institutional affiliations.
Electronic supplementary material
Below is the link to the electronic supplementary material.
Rights and permissions
Open Access This article is licensed under a Creative Commons Attribution-NonCommercial-NoDerivatives 4.0 International License, which permits any non-commercial use, sharing, distribution and reproduction in any medium or format, as long as you give appropriate credit to the original author(s) and the source, provide a link to the Creative Commons licence, and indicate if you modified the licensed material. You do not have permission under this licence to share adapted material derived from this article or parts of it. The images or other third party material in this article are included in the article’s Creative Commons licence, unless indicated otherwise in a credit line to the material. If material is not included in the article’s Creative Commons licence and your intended use is not permitted by statutory regulation or exceeds the permitted use, you will need to obtain permission directly from the copyright holder. To view a copy of this licence, visit http://creativecommons.org/licenses/by-nc-nd/4.0/.
About this article

Cite this article
Choi, J., Son, D., An, S. et al. Effects of Lactiplantibacillus plantarum CBT LP3 and Bifidobacterium breve CBT BR3 supplementation on weight loss and gut microbiota of overweight dogs.
Sci Rep 14, 25446 (2024). https://doi.org/10.1038/s41598-024-75594-9
-
Received:
-
Accepted:
-
Published:
-
DOI: https://doi.org/10.1038/s41598-024-75594-9
Keywords
This post was originally published on this site be sure to check out more of their content.