


Abstract
Ultrasound is an important tool in small animal andrology for assessing the integrity of the testes. This study explores ultrasound’s role in assessing the canine testes and understanding the correlation of sonographic parameters to sperm quality. It investigates B-mode and Doppler ultrasound techniques alongside advanced methods like Shear-wave Elastography (SWE) and Contrast-enhanced ultrasound (CEUS). The aim was to standardize a multiparametric ultrasound (MPUS) evaluation protocol using these techniques in normozoospermic dogs. Eight healthy male dogs were assessed. B-mode assessed testicular morphology, while Doppler evaluated testicular artery waveform morphology and velocimetric parameters. SWE measured testicular stiffness, and CEUS assessed testicular perfusion. Seminal parameters were also analyzed. Results revealed normal B-mode sonographic findings and some correlations between Doppler parameters and sperm quality. SWE demonstrated consistent testicular stiffness regardless of the depth of evaluation, with correlations of the stiffness of the head of the epididymis to the ejaculate volume. CEUS identified blood flow differences between testes and some perfusion parameters correlated with sperm features. This comprehensive ultrasound assessment provides valuable insights into canine reproductive health, providing basis for further studies on dogs with abnormal sperm quality and with different fertility statuses.
Introduction
Ultrasonography is a well-established imaging technique in small animal reproduction. It is commonly used to diagnose and monitor pregnancy, however, it also allows the evaluation of the bitch’s reproductive system to assess its integrity, estrous cycle monitoring and detection of ovulation1,2,3,4. Moreover, it has been considered an important and essential tool for Breeding Soundness Evaluation (BSE) of stud dogs5,6.
Sonographic assessment of the reproductive system of the dog is useful to evaluate the size, shape, location, and internal architecture of the testes and the prostate, as well as adjacent structures7,8. While grayscale (B-mode) and Doppler ultrasound of the testes have been studied in the past and have demonstrated correlation to sperm quality to some extent9,10,11,12,13,14, lack of standardization of the sonographic assessment and seminal collection and evaluation method hinders the full understanding of the potential of this imaging technique5,15.
Elastography is a sonographic technique that allows assessment of tissue stiffness and different techniques commercially available can provide qualitative and quantitative information regarding stiffness16. Strain Elastography (STE) is a qualitative operator-dependent technique that requires an external pressure with the transducer17 and that has been recently studied to understand relative stiffness characteristics of the testes of dogs and correlate them to spermatogenesis18. On the other hand, Shear-wave Elastography (SWE) is a technique that provides a quantitative assessment of tissue stiffness, measuring the shear-wave velocity (SWV) of the tissue under study16,19 and testicular SWV of normozoospermic dogs has been recently studied20, demonstrating its usefulness.
Contrast-enhanced ultrasound (CEUS) is a sonographic technique in which a contrast agent mainly constituted by microbubbles with a gas core and a stabilized and highly reflective shell is administered intravenously, allowing both qualitative and quantitative assessment of tissue perfusion21,22. CEUS features of the canine testes have been studied on normal and abnormal testes as well as in testes after chemical sterilization23,24,25,26, demonstrating its usefulness in small animal practice. While in veterinary medicine CEUS has been mainly focused on differentiating normal, pathological and neoplastic conditions of various types, it has been reported in humans that testicular perfusion parameters can be useful predictors of the success rate of sperm retrieval27, but to the best of the authors’ knowledge, to date, there are no studies of testicular perfusion findings in normozoospermic dogs or correlating perfusion parameters to sperm quality in the canine species.
Multiparametric Ultrasound (MPUS) Imaging is a sonographic approach that combines several sonographic techniques, such as B-mode, Doppler ultrasound, Elastography and CEUS and, in human medicine, MPUS protocols are readily implemented to evaluate organs such as the liver and prostate gland to gather information that goes beyond the morphological appearance of the organ28. Overall, in Veterinary Medicine, few studies explore MPUS protocols and to the best of the authors’ knowledge, no MPUS protocol of the canine testes has been explored and proposed. Therefore, the goal of this pilot study was to perform a standardized MPUS protocol of the testes of normozoospermic dogs using B-mode, Doppler, SWE and CEUS in an attempt to standardize the procedure, obtain normal sonographic data of these patients, as well as correlate quantitative sonographic findings to routine sperm analysis.
Results
A total of eight dogs were included in this study, of which six were Beagle Hounds (75%) and two were French Bulldogs (25%). Age ranged from 1 to 8 years (mean 5.37 ± 2.61) and body weight ranged from 12.40 to 17.20 kg (14.46 ± 1.58). None of the patients presented any abnormalities on physical exam and blood exam was unremarkable. Of all the patients, only the French Bulldogs had already been used for breeding purposes in the past (less than six months) with favorable results, generating healthy offspring. None of the Beagle Hounds had mated previously but presented good libido when stimulated.
Ultrasonographic findings
B-mode
Ultrasonographic assessment was performed without difficulties in the majority of cases, however, the entire sonographic exam (grayscale, Doppler, Elastography and CEUS) was laborious due to the complexity of the protocol and amount of data obtained. In most cases, patients tolerated the examination easily, but in some, patients became somewhat restless during the examination. In these cases, the evaluation was halted and dogs were taken for a walk and allowed to rest for a short period before continuing the assessment.
In grayscale imaging, the testes of all patients presented medium echogenicity, homogenous echotexture, with clear defined hyperechoic tunica albuginea and well preserved mediastinum testis. External testicular measurements (obtained with a caliper) and B-mode measurements did not differ from the right to the left testis, however, when comparing external measurements to sonographic measurements, a significant difference was observed regarding width and volume of the right testis (p = 0.0015 and p = 0.0363 respectively), and height, width and volume of the left testis (p = 0.0042; p = 0.0078 and 0.0282 respectively). Detailed data regarding external and sonographic measurements are shown in Table 1.
Doppler
On Doppler evaluation, it was possible to characterize the testicular artery in all standardized regions using color doppler, as well as it was possible to perform Pulsed-wave analysis at each of these segments without difficulties. Spectral waveform morphology was antegrade and monophasic in all regions of evaluation in 100% of cases. For each patient, waveform morphology did not vary from the right and the left testis. Some waveform morphology differences were present for the proximal supratesticular, middle supratesticular and distal supratesticular due to the presence of an end-systolic notch in some cases.
For the proximal supratesticular region, an end-systolic notch was present in seven out of the eight patients (87,5%) indicating intermediate resistance flow. In only one patient (12,5%) the waveform morphology of this segment demonstrated a prolonged downstroke in late systole followed by a continuous flow throughout diastole and no signs of an end-systolic notch (low resistance).
The middle supratesticular region presented an intermediate resistance flow in 62,5% (5/8) of cases and low resistance in 37,5% (3/8) of cases. The distal supratesticular region demonstrated a predominantly low resistance waveform morphology, as this characteristic was present in 87,5% (7/8) of the cases and only in one patient (12,5%) it presented an intermediate resistance waveform morphology due to the presence of an end-systolic notch. Spectral waveform morphology of the marginal region and the intratesticular region were similar in all cases, presenting a low resistance pattern. Waveform morphology of the different regions of the testicular artery can be appreciated in Fig. 1.
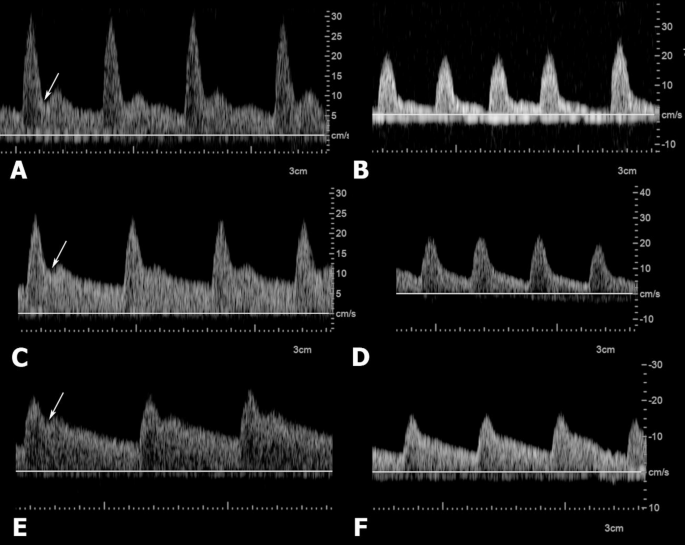
Waveform morphology variability of the proximal (A and B), middle (C and D) and distal (E and F) supratesticular regions of the testicular artery obtained by Pulsed-wave Doppler. Waveforms in A, C and E are characterized by the presence of end-systolic notches (arrows), a key feature of intermediate resistance waveform morphology. B, D and F waveforms have no notching and diastolic flow is continuous with the systolic down flow, characterizing low resistance waveforms.
No differences were found between doppler velocimetric parameters of the right and left testis, therefore, only the variables from the right testis were considered for further analysis. There were significant differences (p < 0.05) in the velocimetric parameters of the testicular artery at the regions evaluated and blood flow velocity and vessel resistance demonstrated a progressive decrease as it ran closer to the testis. Velocimetric results can be found in Table 2.
Pearson’s Correlation Coefficient was calculated between doppler velocimetric parameters from all regions of the testicular artery and seminal characteristics. The volume of the second fraction of the ejaculate presented a strong positive correlation to the PSV, TAMAX and TAMN of the middle supratesticular region (r = 0.810, p = 0.01; r = 0.774, p = 0.02; r = 0.784, p = 0.02 respectively) and the EDV, TAMAX and TAMN of the distal supratesticular region (r = 0.908, p = 0.001; r = 0.832, p = 0.01; r = 0.782, p = 0.02 respectively).
Sperm concentration presented strong negative correlation to the RI from the proximal supratesticular region (r = -0.818, p = 0.01) and the PI from the middle supratesticular region (r = -0.761, p = 0.02). Total sperm output demonstrated a strong positive correlation to the EDV from the middle supratesticular region (r = 0.718, p = 0.04). Total motility and velocity were found to present strong negative correlation to the EDV from the proximal supratesticular region (r = -0.777, p = 0.02, r = -0.849, p = 0.007 respectively).
Seminal plasma concentration of alkaline phosphatase demonstrated strong negative correlation to PSV, EDV, TAMAX and TAMN of the marginal region (r = -0.780, p = 0.02; r = -0.792, p = 0.01; r = 0.769, p = 0.02; r = -0.829, p = 0.01 respectively).
Two-dimensional shear wave elastography (2D-SWE)
Elastographic assessment of the testes was possible in all patients. Qualitative evaluation obtained by the colored elastograms demonstrated that the testes presented predominantly blue tones and the epididymis were predominantly turquoise (Fig. 2).

2-D SWE of the testis and epididymis of a dog. (A) Colored elastogram of the testicular parenchyma, demonstrating predominantly blue tones (soft). Electronic calipers are distributed throughout the parenchyma, three in the more superficial region of the image (FTR), three on top of the mediastinum testis (MTR) and three in the deepest portion of the image (ETR) and shear-wave quantitative values are displayed on the left side of the image. (B) A completely green quality map of the elastogram is seen, indicating high quality acquisition. (C) Colored elastogram of the head of the epididymis, demonstrating lighter blue tones and three electronic calipers are distributed randomly. (D) Quality map of the epididymal elastogram, indicating high quality acquisition.
On quantitative assessment of the testicular parenchyma, no difference was found between stiffness of FTR, MTR and ETR. Stiffness of the head, body and tail of the epididymis did not present significant difference. Shear-wave values from the left and right testis and epididymis did not differ significantly.
A strong negative correlation was observed between the volume of the second fraction of the ejaculate and stiffness of the head of the epididymis (r = -0.839, p = 0.009). Testicular and epididymal stiffness values can be found in Tables 3 and 4, respectively.
Contrast-enhanced ultrasound (CEUS)
It was possible to perform CEUS evaluation of the testes of all patients. On qualitative assessment of the enhancement pattern of the testes, it was possible to observe that seconds after the administration of the contrast medium, enhancement was first detected in the subcapsular arteries and then in the parenchymal arteries, followed by a homogenous moderate enhancement pattern of the parenchyma and still visible and distinguishable parenchymal vessels, characterizing the peak enhancement phase. After the peak, enhancement rapidly decreased and after 90 s of the administration, enhancement of the testicular parenchyma was barely present. Figure 3 shows the enhancement pattern of the testis.

Contrast-enhanced ultrasound (CEUS) of the right testis of a dog. (A) CEUS image at the moment of injection and start of the recording (T = 0s), no enhancement is detected on the testicular parenchyma. (B) Peak enhancement of the testicular parenchyma (T = 14s), in which it is possible to observe enhancement of the intratesticular vessels. (C) A random ROI is place to obtain a Time intensity curve and a gamma variation map, in which five additional ROIs are randomly placed to obtain perfusion parameters. (D) Quantitative perfusion parameters are then provided by the machine.
On quantitative assessment, a significant difference was observed between enhancement peak (%) and AUC (%) of the right and the left testis, where these parameters were greater in the left testis than in the right testis. Other quantitative perfusion parameters did not differ from each testis. Quantitative CEUS data is summarized in Table 5.
Different letters in the same column indicate statistical significance (p < 0.05). Peak: peak intensity; TP: time to peak; MTT: mean transit time; AUC: area under the curve.
The time to peak (TP in s) and mean transit time (MTT in s) of the left testis presented strong negative correlation to the total spermatozoa output (r = -0.813, p = 0.01; r = -0.753, p = 0.03 respectively). Peak intensity from the right and the left testis showed strong negative correlation to sperm vigor (r = -0.709, p = 0.04 ; r = -0.779, p = 0.02 respectively). The AUC of the right testis presented a strong positive correlation to the percentage of morphologically normal sperm cells (r = 0.707, p = 0.04) and a strong negative correlation to the percentage of abnormal sperm cells (r = -0.751, p = 0.03).
Seminal assessment
It was possible to perform semen collection in all patients prior to the experimental analysis for stabilization of epididymal reserves and to standardize period of sexual rest. All patients had ejaculated 5 days prior to the ultrasound evaluation and it was possible to perform another seminal collection just after the ultrasound assessment. All patients included met the criteria established of normozoospermia. Mean values of the seminal findings can be found in Table 6.
Discussion
When performing a BSE of a stud dog, ultrasonography can assess the morphological integrity of the canine testes and prostate, thus it is undoubtedly an important tool for the examination of the male reproductive tract6. While some grayscale features, such as echogenicity and echotexture demonstrate some correlation to seminal quality9,12, further information are necessary to attest reproductive aptitude of the patient. To date, there is only one study correlating Strain Elastography findings of the canine testes to spermatogenesis18 and one study regarding testicular SWE and sperm quality20, but to be best of the author’s knowledge, there are no studies correlating CEUS perfusion findings and a complete MPUS assessment of the testes with every sonographic method available to sperm quality. Findings of this study provide unprecedented information that might aid veterinary theriogenologists and andrologists to further investigate the reproductive potential of the dog.
All patients presented normal testicular morphology bilaterally on grayscale imaging, according to information that has already been described for the canine species regarding testicular normalcy6,7. On grayscale imaging, it is a known factor that the higher the frequency, the greater the resolution, but the poorer the penetration29. The present study standardized the sonographic protocol with a linear transducer capable of performing all sonographic techniques, set at 9 MHz for grayscale imaging, which provided images satisfactorily. While it has been already stated that testicular sonographic imaging can be adequately acquired with linear transducers ranging from 7.5 to 10 MHz6,8, it is prudent to consider that, when available, higher frequencies (> 10 MHz) that allow complete visualization of the field of interest could be preferred to obtain parenchymal images with greater resolution.
Some ultrasonographic measurements of the testes such as height of the left testis and width of both left and right testes were significantly different from those obtained by external measurement and, consequently, testicular volume calculated with the measurements obtained by ultrasound of both testes was greater than when calculated with the external measurements. This is an expected finding, as Gouletsou and colleagues already demonstrated that sonographic measurements of the testes are more accurate than external measurements30. Although testicular volume alone cannot atone for seminal quality, it is an important information that is often included in complete BSE, therefore, ultrasound assessment should be considered the preferred method to assess testicular size and volume in the canine species.
In the present study, volume of both testes was similar, differing from previous studies that report that the volume of the left testis is commonly greater than that of the right testis9,31. This might probably be due to the small number of patients included in the study, considering that a subjective difference can be identified, but no statistical difference was noted. With a greater number of patients, this difference would probably be greater and detected statistically.
Doppler assessment of the distinct regions of the testicular artery demonstrated differences regarding waveform morphology and velocimetric parameters at each portion, as it has been described by Trautwein and colleagues32. However, in the present study, the presence or absence of end-systolic notches provided waveform morphology variations in the proximal supratesticular region, middle supratesticular region and distal supratesticular region. An end-systolic notch is a key feature to indicate intermediate resistance, characterized by rapid deceleration during end systole that is followed by a diastolic acceleration and it can represent normal spectral tracing of some vessels or suggest vasodilatation as a result of exertion or increased temperature33. Considering that in the present study notching was present in the majority of patients and none had abnormal semen quality, this feature might be a normal finding, thus agreeing with Trautwein and colleagues, who reported notching as a normal characteristic of these vessels32. However, further studies are warranted to elucidate if variability regarding waveform morphology due to the presence or absence of notching plays an important factor regarding sperm quality or even fertility.
Positive correlations were found between velocimetric parameters of the middle (PSV, TAMAX and TAMN) and distal (EDV, TAMAX, TAMN) supratesticular region of the testicular artery to the volume of the second fraction of the ejaculate, where the higher the blood flow velocity, the more volume of the second fraction of the ejaculate was present. This might indicate that the higher the blood flow detected in these portions, the more volume will be present in the second fraction of the canine ejaculate. Furthermore, EDV of the proximal supratesticular region of the testicular artery presented strong negative correlations to progressive motility and velocity, indicating that higher diastolic velocities might indicate reduced vascular impedance, potentially leading to less progressive motility and velocity. It is important to consider, however, that blood flow velocities detected in doppler ultrasound are highly dependent of the insonation angle34 and repeatability of these finding could be relied on the doppler settings established. Additionally, considering that velocimetric indexes (RI and PI) of these regions did not correlate to neither the volume of the second fraction of the ejaculate nor progressive motility and velocity, these findings should be interpreted cautiously.
A strong negative correlation was found between to the RI of the proximal supratesticular region and PI of the middle supratesticular region of the testicular artery to sperm concentration, indicating that, the higher these velocimetric parameters, the less concentrated the ejaculate will be. Additionally, a strong positive correlation was seen between the TSO and EDV of the middle supratesticular region of the testicular artery. It has been shown that increased velocimetric indexes are related to an increased resistance to flow35, therefore, it is likely that the higher these parameters, the slower the metabolic activity of the gonads, which could explain the correlation found in the present study. Sperm concentration and TSO, along with other sperm characteristics are important features when evaluating semen samples and they can be key features when considering the implementation of reproductive biotechnologies such as artificial insemination with fresh, chilled or frozen semen, as poorly concentrated or overly diluted semen samples are prone to have a lower percentage of membrane intact sperm cells (MIS) and are less likely to generate pregnancies36,37,38. Interestingly, a correlation between doppler velocimetric parameters and sperm concentration has been reported by Lemos and colleagues31, who were able to identify a positive correlation between the PSV of the distal supratesticular portion of the testicular artery and sperm concentration, as well as a positive correlation between the EDV of the marginal portion to the sperm concentration, while Venianaki and colleagues39 found positive correlations between PSV and EDV of the distal portion of the testicular artery to TSO, motility and blood volume, as well as a negative correlation between the RI of this segment to the TSO, findings which were not present in the current study.
Considering the possible variations of insonation angle on the velocities obtained by Pulsed-wave Doppler, it could be considered that the proximal and middle regions of the testicular artery might be better sites for indirect assessment of sperm concentration of the stud dog, as it has already been pointed out by Trautwein and colleagues13 that these same sites are preferable when evaluating sperm kinetics using a CASA system. Conversely, Venianaki and colleges39 found better correlations between Doppler velocimetric parameters (PSV, EDV, RI and Blood Volume) of the distal supratesticular region of the testicular artery to sperm motility and TSO when evaluating sexual maturity in Beagle dogs. Another study performed by Gloria and colleagues40 reported that on histological assessment, reduced tubular area and reduced seminiferous epithelial thickness were highly correlated to sperm abnormalities and that a slight increase of the RI and PI of the marginal region of the testicular artery could also be observed in testis with abnormal spermatogenesis when evaluating epididymal semen samples. Preferable sites for Doppler assessment are still a conflicting topic in the literature and Doppler velocimetry might also vary according to patient’s individual characteristics, and even patient’s weight41 therefore, although time-consuming, a complete Doppler assessment might be warranted to provide better clinical integration of testicular Doppler ultrasound in a small animal andrology practice, as well as to further investigate the diagnostic capability of the technique.
An important consideration that has to be made is that although several studies have been performed on Doppler evaluation of the testicular artery in dogs, considerable methodological variation can be found in literature, from the Doppler assessment itself to how seminal samples were obtained (digital manipulation vs. epididymal sperm) and evaluated (subjective or objective, time of evaluation, equipment used, periodicity of seminal collections, sexual rest period, specific assessments performed), leading to unmatched or even contradicting results from different authors. It has been pointed out by Arlt and colleagues5 that standardization could be a fundamental key to further explore the technique. The present study attempted to standardize a protocol of a complete sonographic assessment of the canine testes with a specific window of seminal collection, sexual rest period and a routine seminal evaluation. Clinical integration of the present findings might be restricted to the specific conditions established. Furthermore, considering the small sample size of our study, clinical applicability of our findings should be further investigated in both retrospective and prospective studies. Moreover, as already pointed out by Gloria and colleagues40, the establishment of specific thresholds for normal and abnormal testicular blood flow indexes should be done with caution. Stefanizzi and colleagues41 also pointed out that RI and PI of the testicular artery are influenced by the patient’s weight and breed, in which larger breeds might present higher RI and PI than smaller breeds. Therefore, clinical integration of Doppler velocimetric findings of the testicular artery in an andrology practice has to be performed taking into consideration the patient’s individual characteristics, confronted to additional information of the patient’s history and laboratorial findings and cannot be considered diagnostic by itself.
Stiffness of the testicular parenchyma was similar for both testes and no differences at each of the portions evaluated (FTR, MTR and ETR) were found, meaning that the depth of evaluation does not present considerable variation on 2D-SWE and that ROIs including the mediastinum are also similar to the other portions of the parenchyma. In a study conducted by Zappone and colleagues20 using point Shear Wave Elastography (pSWE), the authors found differences in measurements taken on cranial, middle and caudal portion of the parenchyma both above and below the mediastinum, claiming that this finding could be related to different structural anatomy due to the different distribution of seminiferous tubules and lymphatic and blood vessels along the parenchyma. In the same study, however, when performing 2D-SWE, the authors only distinguished measurements performed above and below the mediastinum and found no differences from measurements above and below the mediastinum, similar to our findings.
In the present study, mean testicular stiffness was 1.83 ± 0.33 m/s (95% CI of mean: 1.54–2.10), slightly more variable than the stiffness values found by Zappone and colleagues, in which mean testicular stiffness was 1.65 ± 0.15 m/s (95% CI of mean: 1.62–1.68)20. Considering the overlapping results, it could be suggested that the findings are somewhat similar. but it is prudent to consider that some factor could play a role in the data variability, such as the different animal population size and overall characteristics. Additionally, these authors point out a clear difference between quantitative elastographic values obtained by pSWE when compared to 2D-SWE, in which SWV tends to be lower on the latter. Therefore, clinical integration of SWE in small animal andrology should considerer the technique available and further studies are warranted to understand if different SWE techniques from different equipments might provide similar or conflicting results using larger populations and patients with abnormal sperm quality and even infertility.
On 2D-SWE elastography, epididymal stiffness was similar in all portions evaluated in the present study. Despite being commonly divided into three main regions (head, body and tail), the canine epididymis has 5 distinguishable regions due to histological differences42. Considering that no stiffness difference could be detected among head, body and tail on 2D-SWE elastography, it could be presumed that these structural differences might not translate into significant stiffness variation. It is important, however, to point out that in the present study, no histological evaluations of the testes and epididymis were performed to discard pathological processes, however, considering that all animals were considered healthy and normozoospermic, it could be presumed that no abnormalities were present histologically. Hence, these findings could indicate that in normal conditions, the epididymal stiffness is similar in all of its portions and in cases of focal pathological processes, SWE elastography could aid in the detection of significant stiffness difference among each region. Further studies are warranted to attest these hypotheses.
Interestingly, even though epididymal stiffness was similar in all of its portions in the present study, only the stiffness of the head of the epididymis presented a strong negative correlation to the volume of the second fraction of the ejaculate. The head of the epididymis has a larger number of stereocilia projections than the body and tail and plays an important role in reabsorption of testicular fluid to increase sperm concentration along the epididymal transit42,43. The findings from this study could potentially indicate that an increased stiffness of the head of the epididymis might result in an abnormal water reabsorption during epididymal transit, resulting in a smaller volume of the ejaculate. However, considering that all patients were considered normozoospermic and no histological evaluation was performed on the testes and epididymis, further studies are required to understand if histological modifications of the epididymis due to aging or disease could translate into a decrease in the ejaculate volume. Additionally, it is prudent to understand that this parameter by itself might not be predictive of sperm quality or fertility. Therefore, further studies are warranted to understand the role of epididymal stiffness in sperm quality and fertility of the canine species.
As for CEUS investigation of the testes, an asymmetry was noted of the Enhancement Peak and AUC parameters, which were greater on the left testis compared to the right one. This is an interesting finding, considering that it has been reported that in dogs the left testis might be slightly bigger than the right9,31, it would be reasonable to assume that the perfusion requirement for the left testis would also be greater than that of the right. Although in the present study there were no differences between size and volume of the testes likely because of the sample size, differences found in perfusion might suggest that the left canine testis requires more blood flow due to its usually larger volume. Additionally, considering that no differences were noted on any Doppler velocimetric parameters from the right and left testes, it could be inferred that, although Doppler evaluation of the testes has important implications in clinical practice, it might not detect subtle vascular differences between the right and left testes in the canine species. This could also indicate that early signs of unilateral testicular pathology could be better diagnosed with CEUS instead of any other sonographic technique. Further studies are warranted to test this hypothesis.
Interestingly, in the present study, the TTP and the MTT of the left testis demonstrated a strong negative correlation to the TSO, meaning that the faster the contrast medium arrives at the tissue and the shortest it lingers, the greatest the TSO. The peak intensity of both testes presented a strong positive correlation to sperm velocity and a strong negative correlation to the percentage of abnormal sperm cells, which indicates that the more intense the enhancement, the faster the sperm movement and the smaller the percentage of abnormal sperm cells. Lastly, the AUC of the right testis presented a strong correlation to the percentage of MNS, meaning that the higher the AUC, the greater the percentage of MNS. Perfusion parameters obtained by CEUS can indicate the blood flow volume in the tissue under study, where peak intensity shows how intense the enhancement is identified, TTP determines how fast the contrast medium arrives, MTT corresponds to the mean blood flow velocity and AUC the relative blood volume44. This study provides unprecedented findings on quantitative data of testicular perfusion in normozoospermic dogs, which could aid in future studies to understand how perfusion changes in the testes might affect the sperm quality of the canine species and even provide basis for further studies in other species.
It is important, however, to consider that reproducibility of CEUS quantitative data is strictly related to numerous factors, such as equipment setting, contrast medium handling, dosage, injection velocity, catheter diameter, patient blood pressure, tissue motion, and attenuation21 therefore, these factors should be cautiously considered for clinical integration of the findings from this study, as well as for future studies on the technique.
An important consideration to be made is that in the present study, seminal evaluation did not include computerized assessment of sperm kinetics nor in depth functional assessment of the sperm cells, such as fluorimetric assays of sperm plasmatic membrane integrity, mitochondrial membrane potential or DNA integrity. Furthermore, although eosin-nigrosin staining has been considered as an adequate technique to assess the percentage of dead spermatozoa in canine fresh and frozen-thawed semen samples45, this assessment has been reported to be somewhat unreliable and overestimate the number of MIS when there are less than 80% MIS46. Therefore, even though the seminal evaluation protocol performed in this study represents a routine seminal analysis commonly performed in small animal andrology practice and methodological bias was avoided as best as possible, further studies are recommended to evaluate if more objective and advanced seminal assessments available (sperm kinetics using a standardized CASA system and fluorimetric assays) can present findings that can be correlated to sonographic data obtained.
Another relevant consideration that needs to be made is the fact that only a single seminal evaluation was executed right after MPUS assessment. Considering that epididymal transit takes around 14 days42, it could be reasonable to consider that a seminal collection and evaluation performed two weeks after MPUS evaluation would be more representable of the condition of the testes at the time of the ultrasound. However, it has been shown that some conditions, such as heat stress tend to promote an immediate decrease in sperm parameters in dogs47. Moreover, it has already been theorized by England and colleagues11 that blood flow parameters of the testicular artery obtained by Doppler ultrasound are more likely to reflect on the “current” seminal sample, that is, the sample obtained by the time of ultrasound assessment, considering that primary restrictions of the testicular artery diameter result in rapid testicular changes and, on the other hand, endothelial thickening and changes in blood flow happen secondarily to testicular pathology. The same could be inferred for CEUS evaluation, meaning that CEUS perfusion parameters are most likely to reflect on the seminal sample obtained by the time of the ultrasound assessment rather than samples obtained weeks after. As for SWE, it is unknown whether testicular stiffness parameters could be more reflective of samples obtained by the time of assessment or weeks after. Therefore, further studies are warranted to understand possible correlation to MPUS parameters of the canine testes to seminal samples obtained at different timepoints that take into account epididymal transit and spermatogenic cycle.
In conclusion, MPUS evaluation of the canine testes is feasible and might provide important information that might be correlated with seminal quality. Doppler waveforms of the proximal, middle and distal supratesticular regions of the testicular artery seem to present variations without influencing seminal parameters. A complete Doppler assessment of the Testicular Artery might still be warranted when evaluating the canine reproductive aptitude, but results must be interpreted cautiously and confronted to the patient’s individual characteristics rather than an established normal vs. abnormal threshold. When using 2D-SWE, stiffness of the testes does not seem to vary according to depth and the stiffness of the head of the epididymis might play a role in the final volume of the second fraction of the ejaculate. Additionally, perfusion parameters of normozoospermic dogs observed in this study can be of importance to further investigate the potential of this technique in andrological assessment of the canine species and even for other species of interest. Nevertheless, it is prudent to consider that due to the exploratory nature of this pilot study, the sample size is rather small and only two breeds were included, factors that pose important limitation to the study. Therefore, generalization of the findings should be made with caution. Considering that our study provides a protocol for assessment and baseline data regarding MPUS of the testes in dogs with normal seminal parameters, future studies are warranted to further attest the diagnostic accuracy of this procedure in larger and more heterogenous populations, as well as understand the reproducibility in different experimental settings regarding the timing of seminal evaluation.
Methods
This pilot study was conducted and reported in accordance with the ARRIVE (Animal Research: Reporting of In Vivo Experiments). In addition, elements of the CONSORT (Consolidated Standards of Reporting Trials) guidelines for pilot and feasibility studies were incorporated to ensure transparency in the design, methodology and reporting of a non-randomized pilot study. As the main goal was to establish a protocol and gather preliminary data, no formal sample size calculation was performed. Instead, sample size was chosen pragmatically, reflecting the nature of the study.
Animals
All animals recruited for this research were either from an experimental kennel of the Institution (from the Laboratory of Research in Nutrition and Nutritional Diseases of Dogs and Cats) or from an external kennel from Jaboticabal, Sao Paulo that housed domesticated animals for breeding purposes. All procedures performed followed the ethical principles adopted by the Brazilian College of Animal Experimentation and approval was obtained by the Ethics Committee on Animal Use of the Home Institution (protocol nº 1642/21) prior to the beginning of the experiment. Owners were informed about the methodologies and a consent form was filled and signed to allow participation.
Each patient underwent a thorough general physical evaluation and evaluation of the reproductive tract, including scrotal inspection, testicular palpation and measurement (length, width, height and volume calculated by Lambert’s Empirical Formula48), inspection of the penis and prepuce and rectal palpation of the prostate. Blood samples were collected for blood count assessment. All pertinent history information and general data were obtained. Inclusion criteria were: intact male dogs aging from 1 to 8 years of age; no history of reproductive diseases, no abnormalities detected in physical examination, normal blood count, normal heart rate, normal arterial blood pressure, normal findings in gray-scale ultrasound evaluation of the testes and prostate and normal seminal parameters.
Ultrasonographic evaluation
Ultrasonographic examinations were conducted by a single experienced sonographer using an ACUSON S2000/SIEMENS ultrasound machine, equipped with a linear multifrequency transducer (9.0 MHz). Imaging of the testes was performed without clipping scrotal hair, as to avoid irritation and self-traumatization. Prior to the sonographic evaluation, a 22G peripheral venous catheter was placed in the cephalic vein of all patients. Then, patients were transferred to the noise-free and climatized examination room, where they were placed in dorsal recumbency in a positioning cushion, parallel to the equipment, with their heads towards the equipment. Acoustic gel was applied on the skin and on the transducer to allow acoustic coupling.
Initially, B-mode imaging was performed to assess morphological integrity of the testes. Frequency was set at 9.0 MHz with harmonic imaging for all patients. Other technical adjustments, such as depth, overall gain, time gain compensation, focus and dynamic range were adjusted as necessary to obtain images of diagnostic quality. The testes were evaluated regarding size, shape, margins, echogenicity echotexture and integrity of the mediastinum testis. Scanning was performed in longitudinal, transverse and oblique sections to allow assessment of the entire testicular parenchyma and epididymis. Testicular measurements of length (L) and height (H) were obtained in a longitudinal section and width (W) in a transverse section. After obtaining these parameters, testicular volume (mL) was calculated using Lambert’s Empirical Formula: Testicular Volume (mL) = (L x H x W) x 0.7148.
Doppler ultrasonography
Color Doppler (CD) and Pulsed-wave Doppler (PWD) assessment of the testes was performed. The testicular artery was evaluated throughout its course from the spermatic cord to its branches in the testicular parenchyma. Five regions of the testicular artery were investigated, as standardized by Trautwein and colleagues32: Proximal Supratesticular Region; Middle Supratesticular Region; Distal Supratesticular Region; Marginal Region and Intratesticular Region.
In each of the segments mentioned above, after adequate identification using Color Doppler, Pulsed-wave Doppler was performed. Technical adjustments for Doppler evaluation were performed as recommended by the International Society of Ultrasound in Obstetrics and Gynecology (ISUOG) Guidelines49. Adjustments performed in this study were: 0 db gain in CD and 77dB in PWD; Angle correction with the Steer tool for CD and from 0 to 15º in PWD; Sample Volume limited to the evaluated area in CD and 5 mm for PWD; 6.75 MHz frequency; 94 Hz Wall-filter; Horizontal Sweep Speed adjusted to allow visualization from 4 to 8 heart cycles; PWD acquisition while the B-mode and CD were frozen; Flow Direction in CD as blood flowing towards the transducer was coded red and away from the transducer blue, while in PWD blood flow towards the transducer was above the baseline and away from the transducer was under the baseline.
After proper acquisition and ensuring that at least three consecutive waveforms were similar, waveform morphology was analyzed and classified according to waveform descriptors established by the Consensus Statement of the “Society for Vascular Medicine” and the “Society for Vascular Ultrasound”33. Measurement was performed on at least three consecutive similar waveforms to obtain the following parameters: Peak Systolic Velocity (PSV); End-diastolic Velocity (EDV), Time-averaged Maximum Velocity (TAMAX); Time-averaged Mean Velocity (TAMN); Resistance Index (RI) and Pulsatility Index (PI). Mean values obtained of each parameter from each vessel were then calculated.
Two-dimensional shear wave elastography (2D-SWE)
After thorough evaluation of the testes on grayscale and Doppler imaging, SWE was performed on both testes of all animals. Elastographic evaluation was performed on longitudinal views of the testes. After adequate imaging of the tissues, a colored elastogram was obtained using the Virtual Touch Tissue™ Imaging Quantification; 2D-SWE technique, (Siemens, Germany). The scale of the colored elastogram was adjusted to 10.0 m/s for all images for standardization of the color mapping and a quality map provided by the software was also obtained and images to ensure that speed distribution was homogenous and that a high-quality sample was obtained, evidenced by a predominantly green quality map50. After this procedure, the tonality of each tissue was investigated for qualitive evaluation of relative stiffness.
For quantitative assessment of the testicular stiffness, electronic calipers with fixed dimensions (5 × 5 mm) were placed on the parenchyma at three different locations hereby named according to anatomical landmarks:
-
Free testicular region (FTR): parenchymal region ventral to the mediastinum, close to the free margin of the testis;
-
Mediastinal testicular region (MTR): on top of the mediastinum;
-
Epididymal testicular region (ETR): parenchymal region dorsal to the mediastinum, close to the epididymal margin of the testis.
Three electronic calipers were positioned at each of the locations mentioned above, one in the cranial extremity, one in the center and the last one in the caudal extremity. After positioning the electronic calipers, quantitative values of tissue stiffness were provided in m/s. Mean values were obtained for each region and mean testicular stiffness value was also calculated. Both qualitative and quantitative assessment of epididymal stiffness were also performed. Evaluations were performed on the head, body and tail of the epididymis, where colored elastograms were obtained and stored when acquisition was considered adequate (green quality map) to assess relative stiffness and quantitative values of tissue stiffness was obtained by placing three electronic calipers at each of these regions. Mean values were calculated for each epididymal region and a mean epididymal stiffness valued was also calculated. This procedure was performed on both testes.
Contrast-enhanced ultrasound (CEUS)
For CEUS evaluation, a second-generation contrast medium (SonoVue®, Bracco, Sao Paulo, Brazil) was implemented using a dedicated software for CEUS examination and analysis (CADENCE™ contrast pulse sequencing (CPS) technology, Siemens, Germany). CEUS was performed on both testes in a longitudinal section and technical adjustments were performed as established by Volta and colleagues51. After adequate imaging of the organ, the contrast medium was administered via a peripheral venous catheter (0.03 mL/Kg), followed by the administration of 5 mL saline solution. A 90 seconds video was set to start recording at the moment of injection (T = 0’) with a visible timer. The operator was careful to keep the transducer in the same position throughout this evaluation. Perfusion was then analyzed subjectively regarding the enhancement pattern.
Quantitative assessment was then performed in a dedicated software (Contrast Dynamics™, Siemens, Germany) used to process the videos recorded to obtain time-intensity curves that demonstrated changes in enhancement over time in specific regions of interest (ROIs). A single ROI was drawn on representative enhanced regions of the testes and a time-intensity curve was generated by the equipment. Then, a gamma variate map was obtained from the selected ROI, in which five additional ROIs of approximately 1 mm2 each were placed randomly to avoid methodological bias. After placing these ROIs, the software generated time intensity curves for each and automatically provided the following perfusion parameters: Peak Contrast Intensity (Peak in %), Time to Peak (TTP in s), mean transit time (MTT in s), area under the curve (AUC in %) and the Average Number of Pixels (Pixels).
Semen evaluation
Standardization of semen collection period and sexual rest
Prior to the experimental evaluation, two semen collections at 72 h interval were performed in all dogs for stabilization of epididymal reserves31. After the second seminal collection, all dogs were kept in sexual rest for 5 days. Following the period of sexual rest, patients were then submitted to the experimental protocol (clinical evaluation, ultrasound examination and semen collection). Only the semen sample obtained in the day of the experimental protocol was analyzed. Semen collection was performed by digital manipulation in the absence of a teaser bitch. Only the sperm-rich fraction was stored in a 15 mL Falcon® conical centrifuge tube for immediate analysis. Features such as volume, color and aspect of the ejaculate were recorded52 immediately after collection and evaluation was performed by an experienced evaluator who was blinded to the sonographic findings.
Subjective assessment of motility and velocity
Microscopic evaluation of the semen samples was performed using a phase-contrast microscope (Nikon E200). Sperm motility (range 0–100%) and velocity (1–5) were estimated at 200x and 400x magnification by placing 10 µL of the sample in a microscopic slide and covered with a 22 × 22 mm coverslip, all prewarmed at 37º C52,53,54. The slide was then positioned on a prewarmed (37ºC) heating stage (Neovet, Uberaba, Minas Gerais, Brazil) placed on the microscope and five random fields were selected for evaluation.
Evaluation of sperm concentration, morphology and plasmatic membrane integrity
Sperm concentration was evaluated using a hemocytometer chamber (Improved Neubauer, Bright Line, Boeco, Germany) after diluting semen samples in distilled water (1:20) and results were expressed in millions of spermatozoa per mL (x 106 sptz/mL) and total sperm output in millions of spermatozoa in the ejaculate (x 106 sptz).
To evaluate sperm morphology and plasmatic membrane integrity simultaneously, stained smears were prepared by mixing equal amounts (15 µL) of semen and of a prewarmed commercially available eosin-nigrosin stain (BotuVital®, Botupharma, Botucatu, Sao Paulo, Brazil). After proper mixing, 15 µL of the mixture was then placed onto a clean microscope slide and a second slide was used to perform a smear at a 45º angle. The smears were air dried and were then examined at 1000x magnification under oil immersion. A total number of 200 sperm cells were evaluated regarding morphology and plasmatic membrane integrity. Sperm cells were classified as morphologically normal (MNS) or abnormal, the latter was further classified as major (proximal droplet, knobbed acrosome, midpiece abnormality, abnormal contour of the head, hard coiled tail, double tail and hard bent tail) or minor (distal droplet, detached head, coiled tail and bent tail only in the terminal portion) defect55. For sperm plasmatic membrane integrity, cells that appeared white were classified as live cells (intact plasmatic membrane) and those that appeared pink were classified as dead cells (damaged plasmatic membrane at the time of staining)56,57. Results were expressed in percentage of MNS, percentage of major defects, percentage of minor defects, percentage of abnormal sperm cells and percentage of cells with plasmatic membrane lesion (PML).
Concentration of alkaline phosphatase in seminal plasma (sALP)
After semen collection, an aliquot of 100 µL of the sample was centrifuged at 2500 rotations per minute (rpm) for 10 min. The supernatant (seminal plasma) was pipetted and transferred to a clean 1.5mL microtube. Measurement of the concentration of sALP was performed with a semi-automatic biochemistry analyzer (LABQUEST®, Labtest Diagnostic, Lagoa Santa, MG, Brazil) using a commercial kit (Alkaline Phosphatase Liquiform Ref. 79 − 4/30, Labtest Diagnostic). To allow adequate measurement, seminal plasma was diluted in distilled water (1:100) due to the linearity of the kit (1500 U/L) and as established by Schäfer-Somi and colleagues58.
Criteria for normozoospermia
Patients were considered normozoospermic when the following characteristics were observed on seminal evaluation: opalescent white color; milky aspect; progressive motility > 70%; velocity > 3; total sperm output > 200 × 106 sptz/kg, MNS > 70% and sALP > 5000 U/l52,54,59.
Statistical analysis
All statistical analyzes were performed using the using GraphPad Prism version 8.0.1 for Windows, (GraphPad Software, San Diego, California USA). Quantitative data obtained by clinical, sonographic and seminal evaluation were expressed as mean ± standard deviation (SD), and 95% confidence interval (CI). All quantitative data obtained was evaluated regarding normality of distribution (Shapiro-Wilk test) and when necessary, normalized by log-transformation. Testicular measurements from the right and the left testis obtained by both external measurements and sonographic measurements, as well as doppler velocimetric parameters, elastographic values and perfusion data obtained by CEUS were compared by the paired T test when data met the assumptions of normality and Wilcoxon test when data did not meet assumptions of normality (testicular width and PI of the distal supratesticular region of both testes). Parametric external measurements of each testis were then compared to the sonographic measurements of the same testis using paired T test and nonparametric values (width) were compared using Wilcoxon test.
Doppler velocimetric parameters from each of the five different portions evaluated were compared by Repeated Measures ANOVA (RM-ANOVA) followed by Tukey’s multiple comparison test post hoc. Shear-wave velocities from the different regions of the testicular parenchyma were compared by paired T test. The same procedure was performed to compare stiffness of the portions of the epididymis. Lastly, Pearson’s Correlation Coefficient was calculated between sonographic quantitative data of the testes (including Doppler velocimetry, SWE and CEUS) and seminal parameters. Statistical significance was considered to be present when the p-value (P) was less than 0.05.
Data availability
The datasets generated during and/or analyzed during the current study are available from the corresponding author on reasonable request.
References
-
Davidson, A. P. & Baker, T. W. Reproductive ultrasound of the bitch and queen. Top. Companion Anim. Med. 24, 55–63 (2009).
-
England, G. C. W., Russo, M. & Freeman, S. L. Follicular dynamics, ovulation and conception rates in bitches. Reprod. Domest. Anim. 44, 53–58 (2009).
-
Lévy, X. & Fontbonne, A. Determining the optimal time of mating in bitches: particularities. Ver. Bras. Reprod. Anim. 31, 128–134 (2007).
-
Aires, L. P. N. et al. High-definition ultrasonography in the evaluation of the reproductive tract of bitches during the follicular phase of the estrous cycle. Anim. Reprod. Sci. 234, 106870 (2021).
-
Arlt, S. P. et al. Diagnostic tests in canine andrology – What do they really tell us about fertility? Theriogenology 196, 150–156 (2023).
-
Bracco, C., Gloria, A. & Contri, A. Ultrasound-Based technologies for the evaluation of testicles in the dog: keystones and breakthroughs. Vet. Sci. 10, 683 (2023).
-
Davidson, A. P. & Baker, T. W. Reproductive ultrasound of the dog and tom. Top. Companion Anim. Med. 24, 64–70 (2009).
-
Mattoon, J. S. & Davidson, A. P. Prostate and testes. In Small Animal Diagnostic Ultrasound (eds. Mattoon, J. S., Sellon, R. K. & Berry, C. R.) 635–664 (Elsevier, 2020).
-
de Souza, M. B. et al. Semen quality, testicular B-mode and doppler ultrasound, and serum testosterone concentrations in dogs with established infertility. Theriogenology 84, 805–810 (2015).
-
England, G. C. W. Relationship between ultrasonographic appearance, testicular size, spermatozoal output and testicular lesions in the dog. J. Small Anim. Pract. 32, 306–311 (1991).
-
England, G. C. W. et al. Canine reproductive ultrasound examination for predicting future sperm quality. Reprod. Domest. Anim. 52, 202–207 (2017).
-
Moxon, R. et al. Digital image analysis of testicular and prostatic ultrasonographic echogencity and heterogeneity in dogs and the relation to semen quality. Anim. Reprod. Sci. 160, 112–119 (2015).
-
Trautwein, L. G. C. et al. Correlation of testicular artery doppler velocimetry with kinetics and morphologic characteristics of epididymal sperm in dogs. Reprod. Domest. Anim. 55, 720–725 (2020).
-
Zelli, R., Troisi, A., Elad Ngonput, A., Cardinali, L. & Polisca, A. Evaluation of testicular artery blood flow by doppler ultrasonography as a predictor of spermatogenesis in the dog. Res. Vet. Sci. 95, 632–637 (2013).
-
Mantziaras, G. & Luvoni, G. C. Advanced ultrasound techniques in small animal reproduction imaging. Reprod. Domest. Anim. 55, 17–25 (2020).
-
Gennisson, J. L., Deffieux, T., Fink, M. & Tanter, M. Ultrasound elastography: principles and techniques. Diagn. Interv. Imaging 94, 487–495 (2013).
-
Dietrich, C. F. et al. Strain elastography-How to do it?? Ultrasound Int. Open 3, E137–E149 (2017).
-
Gloria, A., Bracco, C., Di Francesco, L., Marruchella, G. & Contri, A. Stiffness estimated by strain elastography reflects canine testicular spermatogenesis and histology. Theriogenology 209, 1–8 (2023).
-
Garra, B. S. Elastography: history, principles, and technique comparison. Abdom. Imaging 40, 680–697 (2015).
-
Zappone, V. et al. Assessment of testicular stiffness in fertile dogs with shear wave elastography techniques: a pilot study. Front. Vet. Sci. 11, 1–10 (2024).
-
Tang, M. X. et al. Quantitative contrast-enhanced ultrasound imaging: A review of sources of variability. Interface Focus 1, 520–539 (2011).
-
Wilson, S. R. & Burns, P. N. Microbubble-enhanced US in body imaging: What role? Radiology 257, 24–39 (2010).
-
Orlandi, R. et al. Characterization of testicular tumor lesions in dogs by different ultrasound techniques. Animals 12, 210 (2022).
-
Quartuccio, M. et al. Contrast-enhanced ultrasound evaluation of testicular interstitial cell tumours in conscious non-sedated dogs. Vet. Med. (Praha) 63, 125–130 (2018).
-
Leoci, R. et al. Effects of intratesticular vs intraepididymal calcium chloride sterilant on testicular morphology and fertility in dogs. Theriogenology 127, 153–160 (2019).
-
Cicirelli, V. et al. Use of contrast-enhanced ultrasound of the testes after non-surgical sterilization of male dogs with CaCl2 in Alcohol. Animals 12, 577 (2022).
-
Xue, H., Wang, S. Y., Cui, L. G. & Hong, K. Can contrast-enhanced ultrasound increase or predict the success rate of testicular sperm aspiration in patients with azoospermia? Am. J. Roentgenol. 212, 1054–1059 (2019).
-
Sidhu, P. S. Multiparametric ultrasound (MPUS) imaging: terminology describing the many aspects of ultrasonography. Ultraschall Med. Eur. J. Ultrasound 36, 315–317 (2015).
-
Merritt, C. R. B. Physics of ultrasound. In Diagnostic ultrasound. (eds Rumack, C. M. & Levine, D.) 1–34 (Elsevier, Philadelphia, (2018).
-
Gouletsou, P. G., Galatos, A. D. & Leontides, L. S. Comparison between ultrasonographic and caliper measurements of testicular volume in the dog. Anim. Reprod. Sci. 108, 1–12 (2008).
-
Lemos, H. et al. Assessment of dog testis perfusion by colour and pulsed-doppler ultrasonography and correlation with sperm oxidative DNA damage. Top. Companion Anim. Med. 41, 100452 (2020).
-
Trautwein, L. G. C., Souza, A. K. & Martins, M. I. M. Can testicular artery doppler velocimetry values change according to the measured region in dogs? Reprod. Domest. Anim. 54, 687–695 (2019).
-
Kim, E. S. H. et al. Interpretation of peripheral arterial and venous doppler waveforms: A consensus statement from the society for vascular medicine and society for vascular ultrasound. Vasc. Med. 25, 397–515 (2020).
-
Carvalho, C. F., Chammas, M. C. & Cerri, G. G. Princípios Físicos do doppler Em ultra-sonografia. Ciência Rural 38, 872–879 (2008).
-
Boote, E. J. AAPM/RSNA Physics Tutorial for Residents: Topics in US: Doppler US techniques: concepts of blood flow detection and flow dynamics. RadioGraphics 23, 1315–1327 (2003).
-
Mickelsen, W. D., Memon, M. A., Anderson, P. B. & Freeman, D. A. The relationship of semen quality to pregnancy rate and litter size following artificial insemination in the bitch. Theriogenology 39, 553–560 (1993).
-
Sugai, N., Werre, S., Cecere, J. T. & Balogh, O. Comparing different sperm concentrations for optimizing cooled semen use in the dog. Front. Vet. Sci. 10, 1339840 (2023).
-
Tesi, M. et al. Variables affecting semen quality and its relation to fertility in the dog: A retrospective study. Theriogenology 118, 34–39 (2018).
-
Venianaki, A. P., Barbagianni, M., Fthenakis, G., Galatos, A. D. & Gouletsou, P. G. Doppler examination of the testicular artery of beagle-breed dogs from birth to puberty. Tomography 9, 1408–1422 (2023).
-
Gloria, A., Di Francesco, L., Marruchella, G., Robbe, D. & Contri, A. Pulse-wave doppler pulsatility and resistive indexes of the testicular artery increase in canine testis with abnormal spermatogenesis. Theriogenology 158, 454–460 (2020).
-
Stefanizzi, E., Valenčáková, A., Schmiesterová, K., Figurová, M. & Hornakova, L. The use of doppler ultrasonography in the examination of testicles in dogs. Acta Vet. Brno 72, 453–467 (2022).
-
Hassan, H. A. et al. Canine and feline epididymal semen—a plentiful source of gametes. Animals 11 (2021).
-
Sullivan, R. & Mieusset, R. The human epididymis: its function in sperm maturation. Hum. Reprod. Update 22, 574–587 (2016).
-
Greis, C. Quantitative evaluation of microvascular blood flow by contrast-enhanced ultrasound (CEUS). Clin. Hemorheol. Microcirc. 49, 1–4 (2011).
-
Daub, L., Geyer, A., Reese, S., Braun, J. & Otzdorff, C. Sperm membrane integrity in fresh and frozen–thawed canine semen samples: a comparison of vital stains with the nucleocounter SP-100. Theriogenology 86, 651–656 (2015).
-
Watts, J. Measurement of membrane integrity in canine spermatozoa using a fluorescent computer-assisted spermatozoal quantification method and manual counting after eosin-nigrosin staining compared with manual counting after CFDA/PI staining. Reprod. Domest. Anim. 54, 1583–1595 (2019).
-
Lyrio, L. L. et al. Effects of heat stress on sperm quality of french bulldogs. Theriogenology 199, (2023).
-
Lambert, B. The frequency of mumps and of mumps orchitis and the consequences for sexuality and fertility. Acta Genet. Stat. Med. 2, (1951).
-
Bhide, A. et al. ISUOG practice guidelines (updated): use of doppler velocimetry in obstetrics. Ultrasound Obstet. Gynecol. 58, 331–339 (2021).
-
Li, X. L. et al. Value of virtual touch tissue imaging quantification for evaluation of ultrasound breast imaging-Reporting and data system category 4 lesions. Ultrasound Med. Biol. 42, 2050–2057 (2016).
-
Volta, A. et al. Use of contrast-enhanced ultrasonography in chronic pathologic canine testes. Reprod. Domest. Anim. 49, 202–209 (2014).
-
Kustritz, M. V. R. The value of canine semen evaluation for practitioners. Theriogenology 68, 329–337 (2007).
-
de Souza, F. F., Barreto, C. S. & Lopes, M. D. Characteristics of seminal plasma proteins and their correlation with canine semen analysis. Theriogenology 68, 100–106 (2007).
-
Lopate, C. Applied animal andrology: dog. In Manual of Animal Andrology 160–186 (2022).
-
Barth, A. D. & Oko, R. J. Abnormal Morphology of Bovine Spermatozoa. (1989).
-
Hancock, J. L. A staining technique for the study of temperature-shock in semen. Nature 167, (1951).
-
Dott, H. M. & Foster, G. C. A technique for studying the morphology of mammalian spermatozoa which are eosinophilic in a differential ‘life-dead’ stain. J. Reprod. Fertil. 29, 443–445 (1972).
-
Schäfer-Somi, S., Fröhlich, T. & Schwendenwein, I. Measurement of alkaline phosphatase in canine seminal plasma – An update. Reprod. Domest. Anim. 48, e10–e12 (2013).
-
Gobello, C. & Corrada, Y. Acquired infertility in male dogs with normal libido. Compend. Continu. Educ. Practic. Vet. 26, 18–28 (2004).
Acknowledgements
The authors thank Jair Matos from Siemens Healthineers for the technical assistance provided. This study was funded by FAPESP (Fundação de Amparo à Pesquisa do Estado de São Paulo), grants nº 17/14957-6; 19/15282-8; 22/04907-0 and 23/13094-5.
Author information
Authors and Affiliations
Contributions
Luiz Paulo Nogueira Aires: Conceptualization, Methodology, Resources, Investigation, Data Curation, Formal Analysis, Writing – Original Draft, Writing – Review and Editing, Project Administration, Funding Acquisition. Beatriz Gasser, Priscila Del’Aguila-Silva, Joedson Dantas Gonçalves, Bruna Bressianini Lima: Methodology, Resources, Investigation, Data Curation. Ricardo Andrés Ramirez Uscategui, Lindsay Unno Gimenes, Marcus Antônio Rossi Feliciano: Conceptualization, Methodology, Supervision, Resources, Formal analysis, Writing – review & editing, Project administration, Funding acquisition. Daniela De Felice, Stefano Spada, Marco Russo: Visualization, Writing – Original Draft, Writing – Review and Editing.
Corresponding author
Ethics declarations
Competing interests
The authors declare no competing interests.
Additional information
Publisher’s note
Springer Nature remains neutral with regard to jurisdictional claims in published maps and institutional affiliations.
Rights and permissions
Open Access This article is licensed under a Creative Commons Attribution-NonCommercial-NoDerivatives 4.0 International License, which permits any non-commercial use, sharing, distribution and reproduction in any medium or format, as long as you give appropriate credit to the original author(s) and the source, provide a link to the Creative Commons licence, and indicate if you modified the licensed material. You do not have permission under this licence to share adapted material derived from this article or parts of it. The images or other third party material in this article are included in the article’s Creative Commons licence, unless indicated otherwise in a credit line to the material. If material is not included in the article’s Creative Commons licence and your intended use is not permitted by statutory regulation or exceeds the permitted use, you will need to obtain permission directly from the copyright holder. To view a copy of this licence, visit http://creativecommons.org/licenses/by-nc-nd/4.0/.
About this article

Cite this article
Aires, L.P.N., Gasser, B., Del’Aguila-Silva, P. et al. Multiparametric ultrasound (MPUS) evaluation of the testes of normozoospermic dogs – a pilot study.
Sci Rep 15, 7121 (2025). https://doi.org/10.1038/s41598-025-91087-9
-
Received:
-
Accepted:
-
Published:
-
DOI: https://doi.org/10.1038/s41598-025-91087-9
Keywords
This post was originally published on this site be sure to check out more of their content.