
Feb 24, 2025
IndexBox has just published a new report: China – Handbags – Market Analysis, Forecast, Size, Trends And Insights.
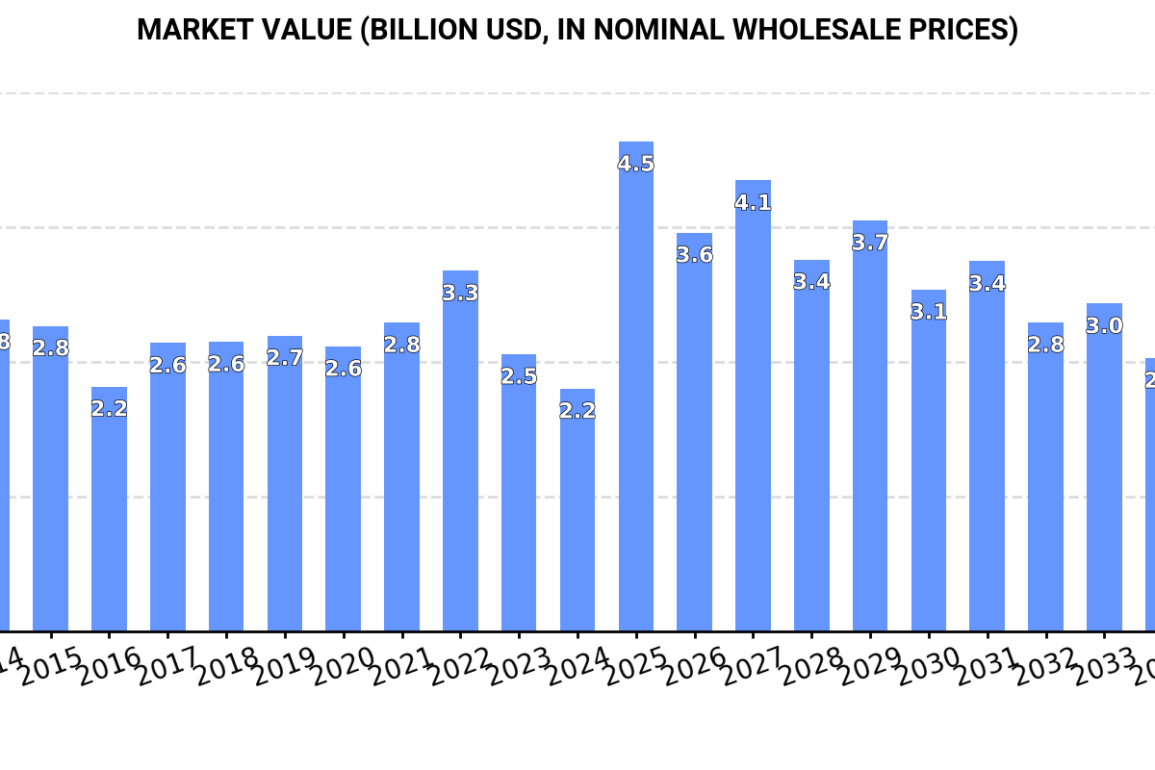
The handbag market in China is expected to see a positive trend in consumption, with a forecasted CAGR of +0.8% in volume and +1.5% in value from 2024 to 2035. This growth is anticipated to bring the market volume to 715 million units and the market value to $2.6 billion by the end of 2035.
Market Forecast
Driven by rising demand for handbag in China, the market is expected to start an upward consumption trend over the next decade. The performance of the market is forecast to increase slightly, with an anticipated CAGR of +0.8% for the period from 2024 to 2035, which is projected to bring the market volume to 715M units by the end of 2035.
In value terms, the market is forecast to increase with an anticipated CAGR of +1.5% for the period from 2024 to 2035, which is projected to bring the market value to $2.6B (in nominal wholesale prices) by the end of 2035.

Consumption
China’s Consumption of Handbags
In 2024, consumption of handbags decreased by -12.9% to 654M units, falling for the second year in a row after two years of growth. Overall, consumption recorded a pronounced reduction. As a result, consumption attained the peak volume of 967M units. From 2023 to 2024, the growth of the consumption failed to regain momentum.
The revenue of the handbag market in China fell to $2.2B in 2024, waning by -12.4% against the previous year. This figure reflects the total revenues of producers and importers (excluding logistics costs, retail marketing costs, and retailers’ margins, which will be included in the final consumer price). In general, consumption showed a pronounced decline. Handbag consumption peaked at $3.3B in 2022; however, from 2023 to 2024, consumption failed to regain momentum.
Production
China’s Production of Handbags
In 2024, the amount of handbags produced in China rose to 2.9B units, picking up by 2% against the previous year’s figure. Over the period under review, production, however, continues to indicate a mild shrinkage. The most prominent rate of growth was recorded in 2016 with an increase of 138%. As a result, production reached the peak volume of 7.3B units. From 2017 to 2024, production growth failed to regain momentum.
In value terms, handbag production amounted to $9.9B in 2024 estimated in export price. In general, production, however, continues to indicate a slight setback. The most prominent rate of growth was recorded in 2016 when the production volume increased by 75% against the previous year. As a result, production reached the peak level of $18.5B. From 2017 to 2024, production growth remained at a somewhat lower figure.
Imports
China’s Imports of Handbags
After two years of decline, overseas purchases of handbags increased by 5.8% to 18M units in 2024. Overall, imports saw a remarkable increase. The pace of growth was the most pronounced in 2014 when imports increased by 26% against the previous year. Imports peaked at 20M units in 2021; however, from 2022 to 2024, imports remained at a lower figure.
In value terms, handbag imports fell to $4.3B in 2024. In general, imports continue to indicate a prominent expansion. The most prominent rate of growth was recorded in 2021 when imports increased by 55%. As a result, imports reached the peak of $5.1B. From 2022 to 2024, the growth of imports remained at a lower figure.
Imports By Country
In 2023, France (11M units) constituted the largest supplier of handbag to China, with a 67% share of total imports. Moreover, handbag imports from France exceeded the figures recorded by the second-largest supplier, Vietnam (3M units), fourfold. The third position in this ranking was taken by Italy (2.4M units), with a 14% share.
From 2013 to 2023, the average annual growth rate of volume from France stood at +23.6%. The remaining supplying countries recorded the following average annual rates of imports growth: Vietnam (+21.6% per year) and Italy (+14.2% per year).
In value terms, the largest handbag suppliers to China were Italy ($2.1B), France ($1.6B) and Vietnam ($201M), together accounting for 82% of total imports. Cambodia, Indonesia, the Philippines, South Korea, the United States, Bangladesh and India lagged somewhat behind, together comprising a further 9.6%.
Among the main suppliers, Cambodia, with a CAGR of +99.8%, recorded the highest growth rate of the value of imports, over the period under review, while purchases for the other leaders experienced more modest paces of growth.
Imports By Type
In 2024, handbags with outer surface of plastic sheeting or of textile materials (13M units) constituted the largest type of handbags supplied to China, with a 76% share of total imports. Moreover, handbags with outer surface of plastic sheeting or of textile materials exceeded the figures recorded for the second-largest type, handbags with outer surface of leather, composition leather, or patent leather (4.3M units), threefold.
From 2013 to 2024, the average annual rate of growth in terms of the volume of handbags with outer surface of plastic sheeting or of textile materials imports amounted to +10.3%. With regard to the other supplied products, the following average annual rates of growth were recorded: handbags with outer surface of leather, composition leather, or patent leather (+9.9% per year) and handbags with outer surface of vulcanised fibre or of paperboard (-3.4% per year).
In value terms, handbags with the largest imports in China were handbags with outer surface of leather, composition leather, or patent leather ($2.3B), handbags with outer surface of plastic sheeting or of textile materials ($2B) and handbags with outer surface of vulcanised fibre or of paperboard ($2.1M).
In terms of the main product categories, handbags with outer surface of plastic sheeting or of textile materials, with a CAGR of +21.7%, saw the highest rates of growth with regard to the value of imports, over the period under review, while purchases for the other products experienced more modest paces of growth.
Import Prices By Type
In 2024, the average handbag import price amounted to $248 per unit, with a decrease of -13.6% against the previous year. In general, the import price, however, recorded a moderate expansion. The pace of growth was the most pronounced in 2020 an increase of 43%. The import price peaked at $287 per unit in 2023, and then contracted in the following year.
Prices varied noticeably by the product type; the product with the highest price was handbags with outer surface of leather, composition leather, or patent leather ($544 per unit), while the price for handbags with outer surface of vulcanised fibre or of paperboard ($112 per unit) was amongst the lowest.
From 2013 to 2024, the most notable rate of growth in terms of prices was attained by handbags with outer surface of plastic sheeting or of textile materials (+10.3%), while the prices for the other products experienced more modest paces of growth.
Import Prices By Country
In 2023, the average handbag import price amounted to $287 per unit, picking up by 9.8% against the previous year. Over the period under review, the import price recorded buoyant growth. The most prominent rate of growth was recorded in 2020 when the average import price increased by 43% against the previous year. The import price peaked in 2023 and is expected to retain growth in years to come.
Prices varied noticeably by country of origin: amid the top importers, the country with the highest price was Italy ($894 per unit), while the price for Bangladesh ($33 per unit) was amongst the lowest.
From 2013 to 2023, the most notable rate of growth in terms of prices was attained by the United States (+9.0%), while the prices for the other major suppliers experienced more modest paces of growth.
Exports
China’s Exports of Handbags
In 2024, overseas shipments of handbags increased by 7.3% to 2.2B units, rising for the fourth year in a row after two years of decline. Over the period under review, exports, however, showed a slight descent. The pace of growth appeared the most rapid in 2016 when exports increased by 188%. As a result, the exports attained the peak of 6.5B units. From 2017 to 2024, the growth of the exports failed to regain momentum.
In value terms, handbag exports contracted modestly to $7.3B in 2024. Overall, exports, however, continue to indicate a slight descent. The pace of growth appeared the most rapid in 2021 when exports increased by 30% against the previous year. Over the period under review, the exports attained the peak figure at $9B in 2015; however, from 2016 to 2024, the exports stood at a somewhat lower figure.
Exports By Country
The United States (271M units), Japan (222M units) and the Philippines (85M units) were the main destinations of handbag exports from China, with a combined 28% share of total exports.
From 2013 to 2023, the biggest increases were recorded for the Philippines (with a CAGR of +17.8%), while shipments for the other leaders experienced more modest paces of growth.
In value terms, the largest markets for handbag exported from China were the United States ($912M), Japan ($571M) and South Korea ($326M), together comprising 24% of total exports. Italy, Malaysia, Russia, Hong Kong SAR, the UK, Spain, the Netherlands, Germany, the Philippines and Mexico lagged somewhat behind, together accounting for a further 30%.
Among the main countries of destination, the Philippines, with a CAGR of +16.7%, recorded the highest growth rate of the value of exports, over the period under review, while shipments for the other leaders experienced more modest paces of growth.
Exports By Type
Handbags with outer surface of plastic sheeting or of textile materials (2.2B units) was the largest type of handbags exported from China, accounting for a 96% share of total exports. It was followed by handbags with outer surface of leather, composition leather, or patent leather (48M units), with a 2.1% share of total exports.
From 2013 to 2024, the average annual growth rate of the volume of handbags with outer surface of plastic sheeting or of textile materials exports was relatively modest. With regard to the other exported products, the following average annual rates of growth were recorded: handbags with outer surface of leather, composition leather, or patent leather (-10.1% per year) and handbags with outer surface of vulcanised fibre or of paperboard (-3.3% per year).
In value terms, handbags with outer surface of plastic sheeting or of textile materials ($6.6B) remains the largest type of handbags exported from China, comprising 90% of total exports. The second position in the ranking was taken by handbags with outer surface of leather, composition leather, or patent leather ($675M), with a 9.2% share of total exports.
From 2013 to 2024, the average annual growth rate of the value of handbags with outer surface of plastic sheeting or of textile materials exports was relatively modest. With regard to the other exported products, the following average annual rates of growth were recorded: handbags with outer surface of leather, composition leather, or patent leather (-10.3% per year) and handbags with outer surface of vulcanised fibre or of paperboard (+6.8% per year).
Export Prices By Type
The average handbag export price stood at $3.3 per unit in 2024, shrinking by -8.8% against the previous year. Over the period under review, the export price recorded a relatively flat trend pattern. The pace of growth appeared the most rapid in 2017 an increase of 198%. Over the period under review, the average export prices reached the peak figure at $4 per unit in 2022; however, from 2023 to 2024, the export prices failed to regain momentum.
There were significant differences in the average prices for the major types of exported product. In 2024, the product with the highest price was handbags with outer surface of leather, composition leather, or patent leather ($14 per unit), while the average price for exports of handbags with outer surface of vulcanised fibre or of paperboard ($2 per unit) was amongst the lowest.
From 2013 to 2024, the most notable rate of growth in terms of prices was recorded for the following types: handbags with outer surface of vulcanised fibre or of paperboard (+10.5%), while the prices for the other products experienced mixed trend patterns.
Export Prices By Country
The average handbag export price stood at $3.6 per unit in 2023, with a decrease of -10.1% against the previous year. In general, the export price, however, recorded a relatively flat trend pattern. The pace of growth appeared the most rapid in 2017 an increase of 198% against the previous year. The export price peaked at $4 per unit in 2022, and then fell in the following year.
There were significant differences in the average prices for the major external markets. In 2023, amid the top suppliers, the country with the highest price was Hong Kong SAR ($15 per unit), while the average price for exports to the Philippines ($1.8 per unit) was amongst the lowest.
From 2013 to 2023, the most notable rate of growth in terms of prices was recorded for supplies to Hong Kong SAR (+8.1%), while the prices for the other major destinations experienced more modest paces of growth.
Source: IndexBox Market Intelligence Platform
This post was originally published on this site be sure to check out more of their content.